Figure 6.
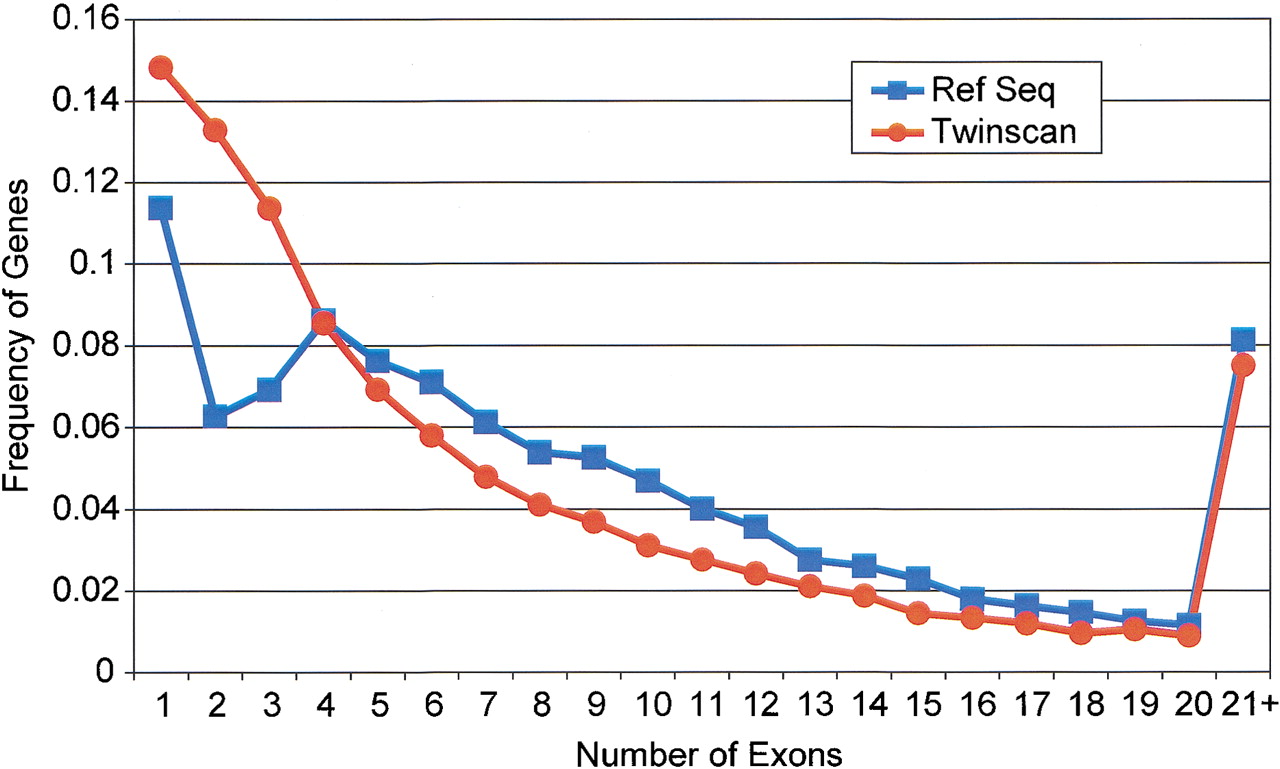
Comparison of the distribution of coding exons per transcript in the TWINSCAN predictions and RefSeq annotations. The last data point includes all transcripts containing >20 coding exons.
Comparison of the distribution of coding exons per transcript in the TWINSCAN predictions and RefSeq annotations. The last data point includes all transcripts containing >20 coding exons.