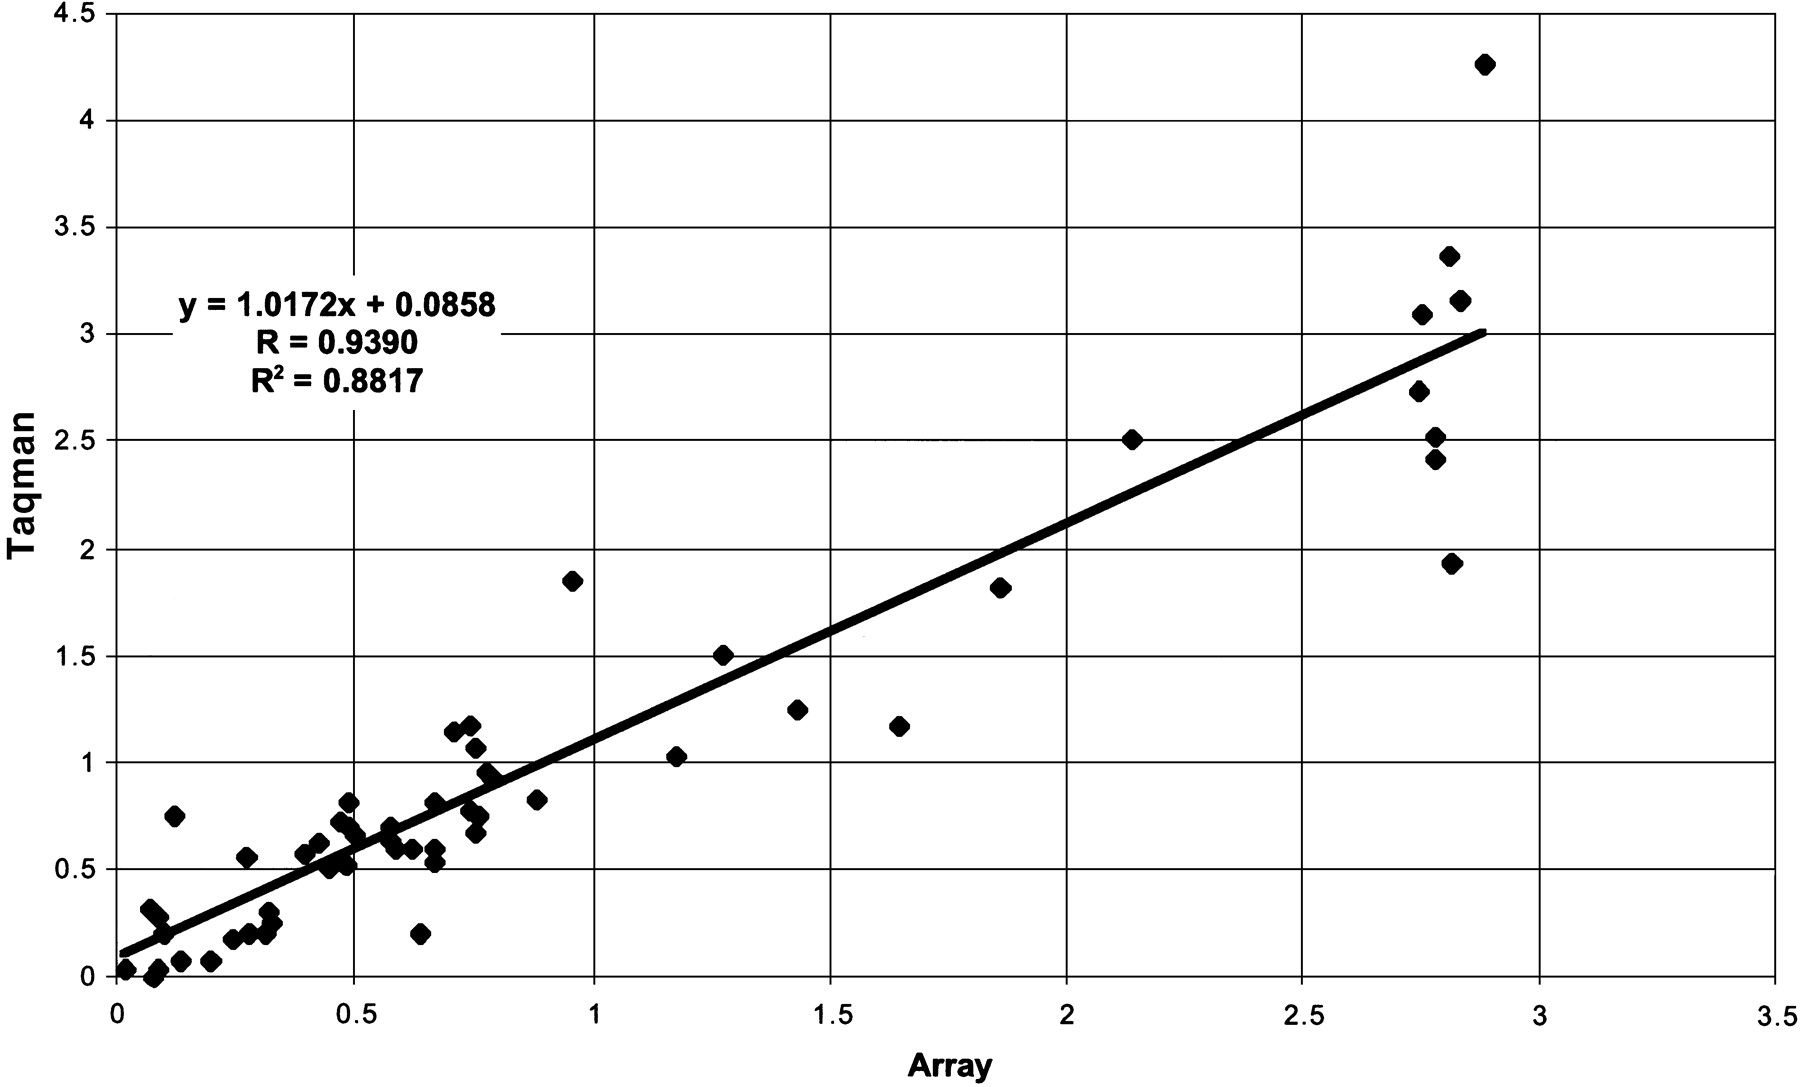
Figure 6.
Log ratio plot comparing fold change data from arrays and Taqman. The fold changes for 55 mouse genes in mouse liver and mouse spleen samples were calculated from array and Taqman data, and the log ratio of the fold changes was plotted.
Log ratio plot comparing fold change data from arrays and Taqman. The fold changes for 55 mouse genes in mouse liver and mouse spleen samples were calculated from array and Taqman data, and the log ratio of the fold changes was plotted.