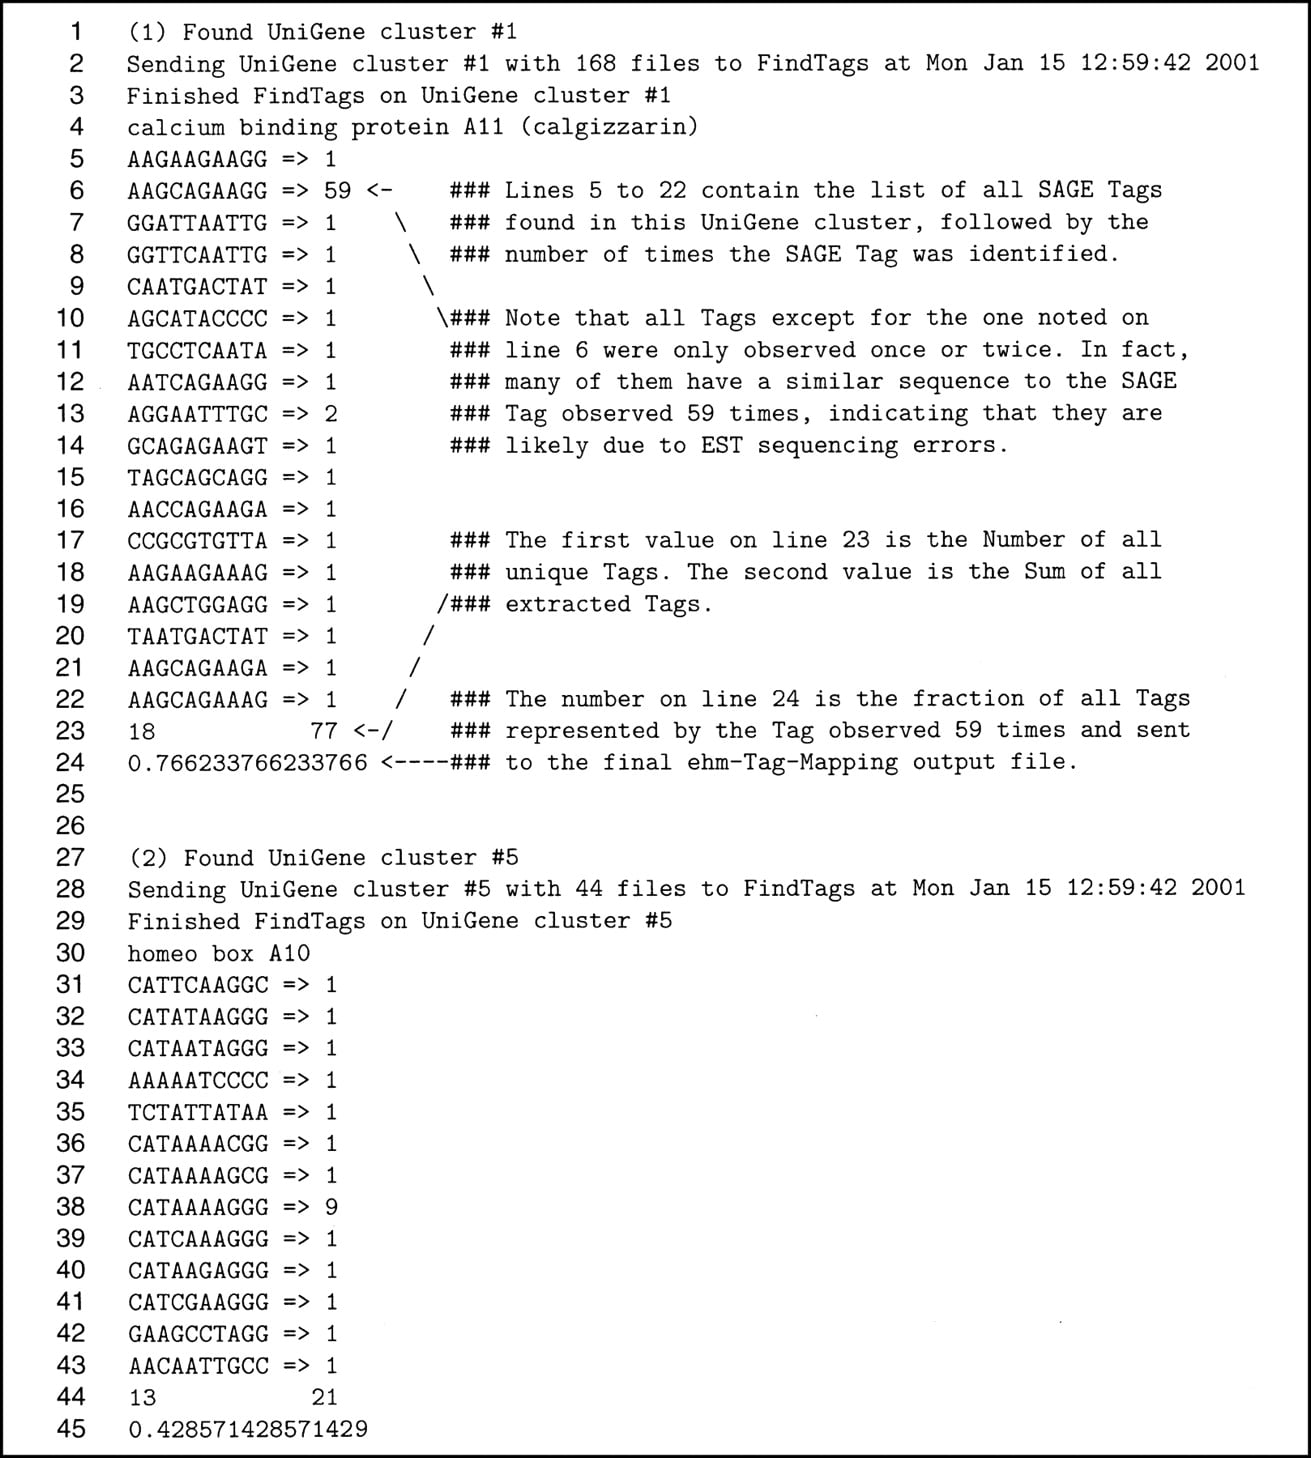
Figure 6.
Representative output from the ehm-tag-Mapping log file for the first two analyzed UniGene clusters. The first entry of the log file has been annotated for explanation purposes after the ###.
Representative output from the ehm-tag-Mapping log file for the first two analyzed UniGene clusters. The first entry of the log file has been annotated for explanation purposes after the ###.