Figure 5.
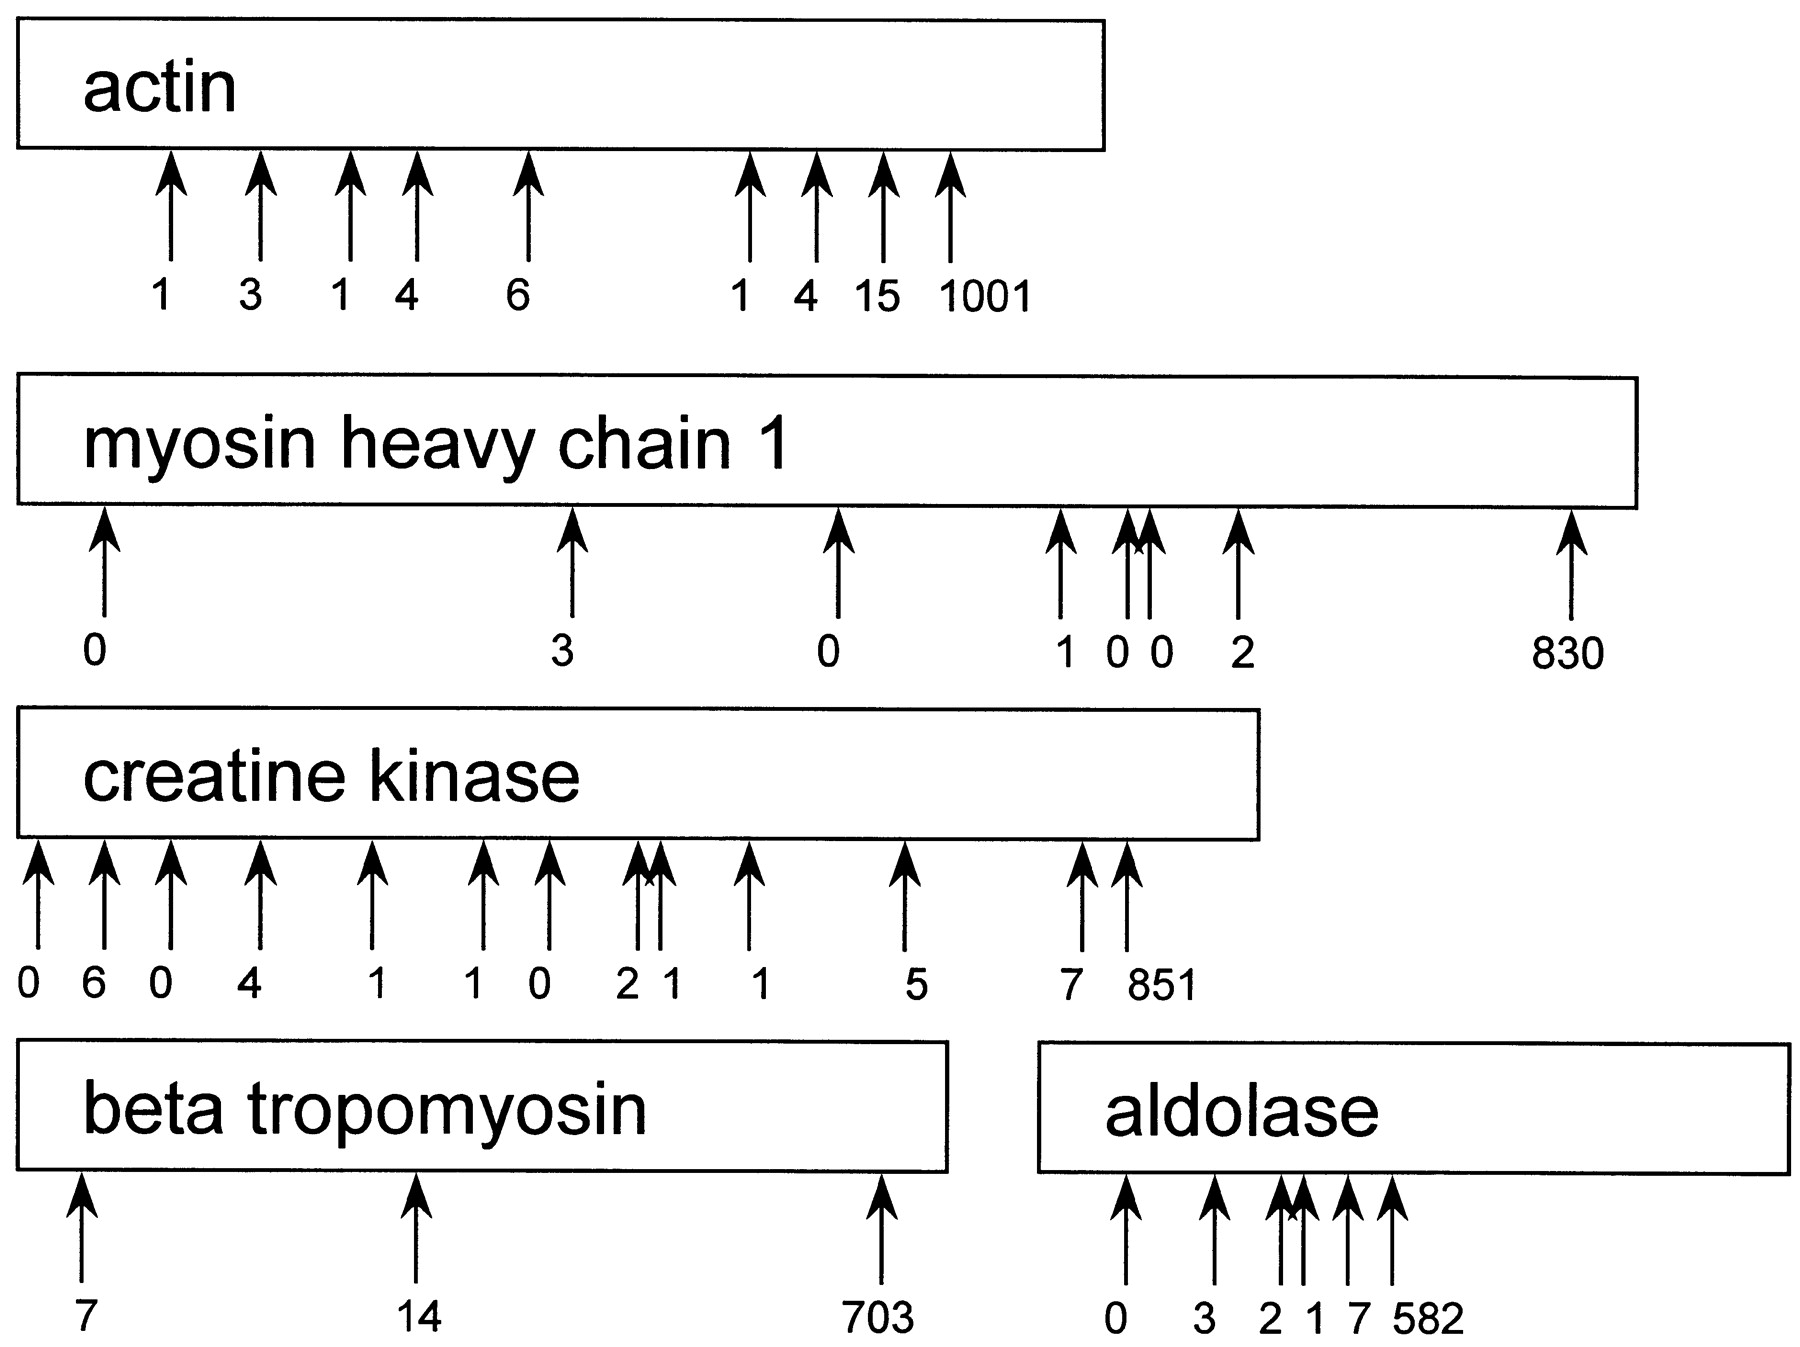
Map of the NlaIII restriction sites in some of the most abundant nonmitochondrial cDNAs, and abundances of the SAGE tags corresponding to each of these sites.
Map of the NlaIII restriction sites in some of the most abundant nonmitochondrial cDNAs, and abundances of the SAGE tags corresponding to each of these sites.