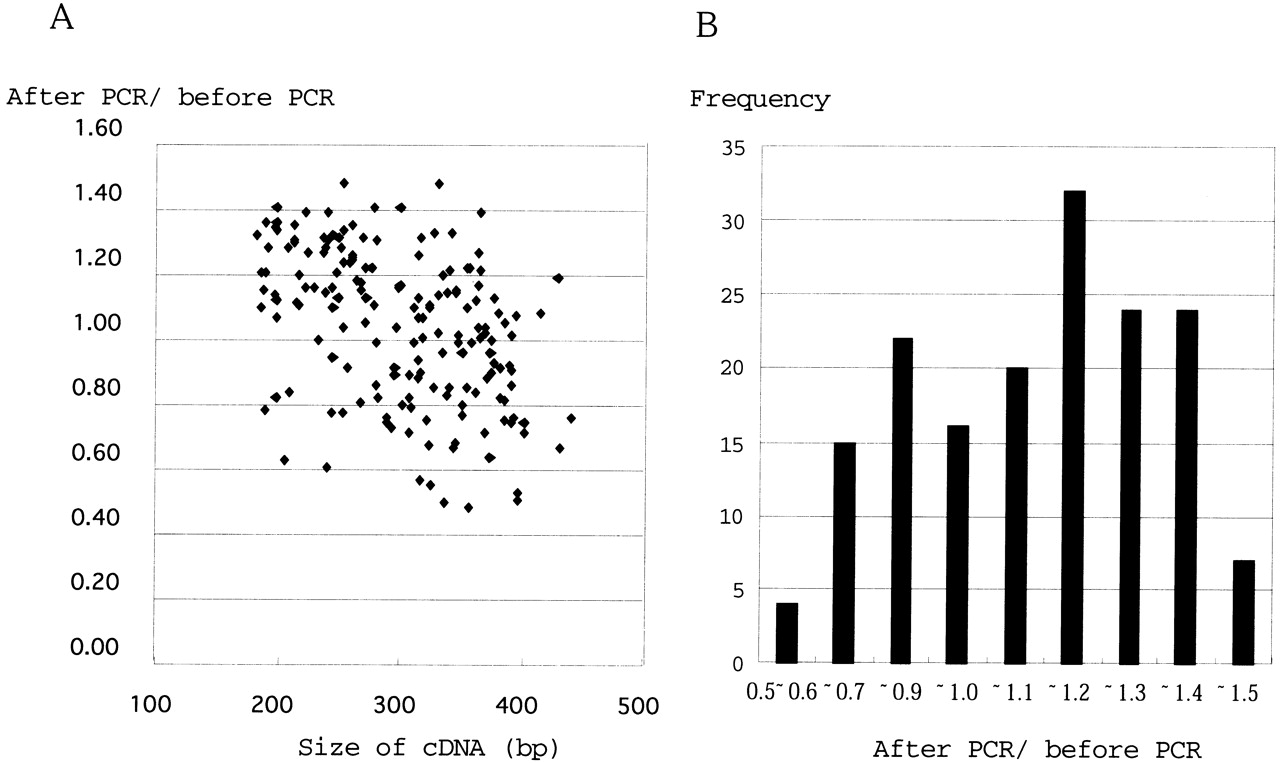
Figure 5.
(A) Amplification ratios of 175 cDNAs and their sizes. Correlation between amplification ratio (after PCR/before PCR) and insert size was tested by Spearman's correlation coefficient by rank test (StatView 4.0, ABACUS Concepts, Inc., MA) and a moderate correlation was suggested. The correlation coefficient (r) with risk <0.5% was −0.47. P = 7.6 × 10⁻¹⁰;Z = −6.15, Z (0.975) = 1.96. (B) Frequency distribution of amplification ratios. The average of ratio was 1.1 with standard deviation of 0.24.