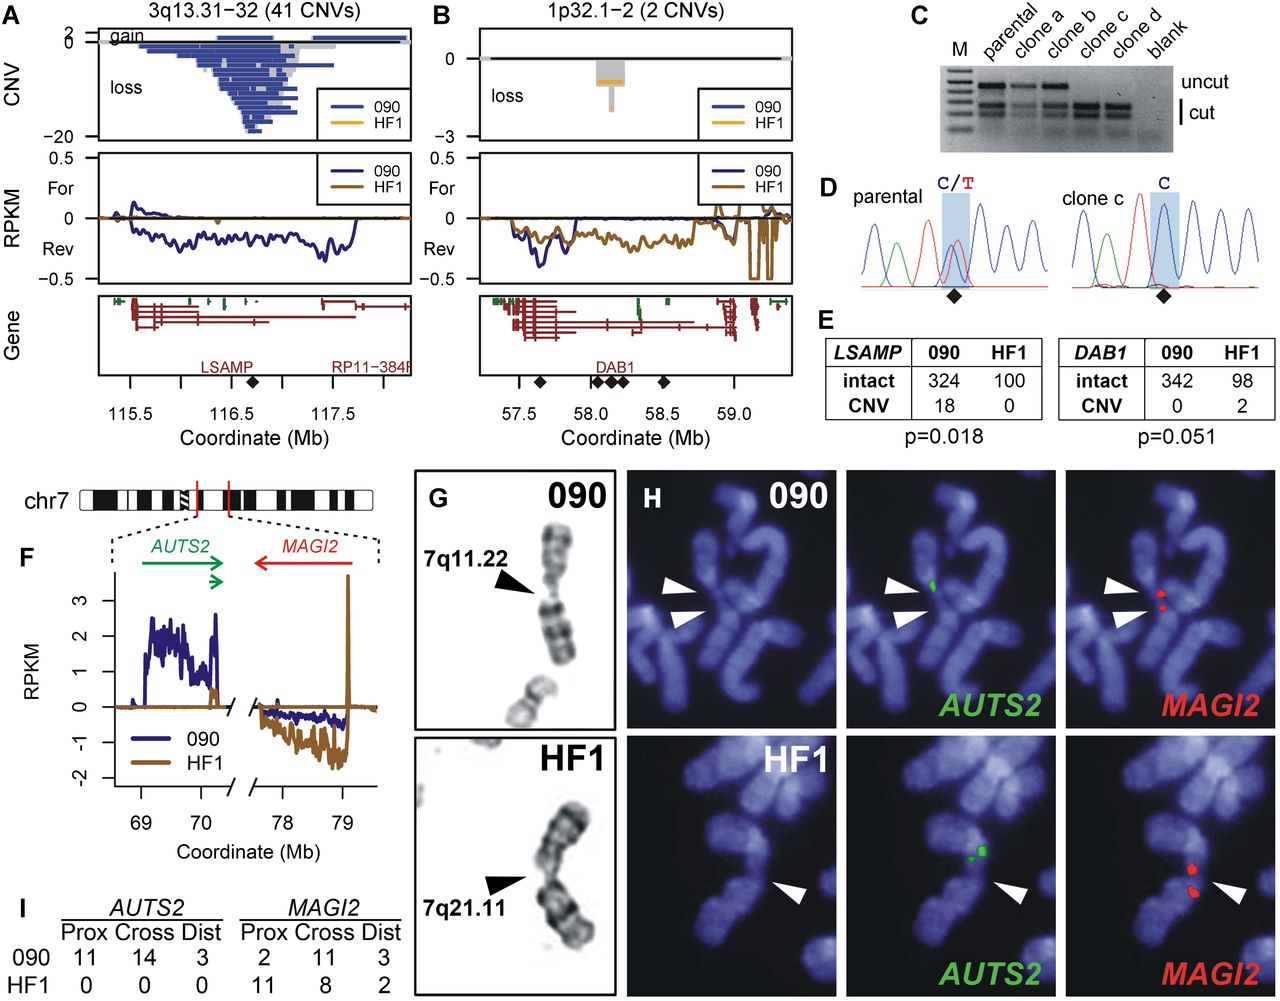
Cell-type-specific prediction of unstable loci at active large transcription units. (A,B) Chromosome region profiles, similar to Figure 1, B and C, for genes LSAMP and DAB1, respectively, with CNVs colored by their detection in either 090 or HF1 fibroblasts. Diamonds mark the positions of SNP RFLPs interrogated in HF1. (C) BccI digestion of SNP rs79114629 PCR products for HF1 parental cells and two APH-treated clones lacking (a and b) and containing (c and d) a deletion CNV. (D) Sequence analysis of clone c demonstrating LOH at SNP rs79114629. (E) Allele counts for LSAMP and DAB1, where 090 counts only include CNVs from treated clones detectable by the HF1 RFLP analysis. (F) Portions of 090 and HF1 Bru-seq transcription data relevant to CFS analysis at 7q11.22–q21.11, showing differential transcription of AUTS2. (G) Examples of G-banded chromosomes demonstrating breaks at 7q11.22 in 090 (top) and 7q21.11 in HF1 (bottom). (H) Representative FISH on DAPI stained chromosomes using probes to AUTS2 (green, middle) and MAGI2 (red, right). 090 shows breaks at both loci in a single chromosome (top), while HF1 shows a break at MAGI2 (bottom). (I) Summary of 090 and HF1 CFS breaks with respect to AUTS2 and MAGI2 FISH probes.