Figure 5.
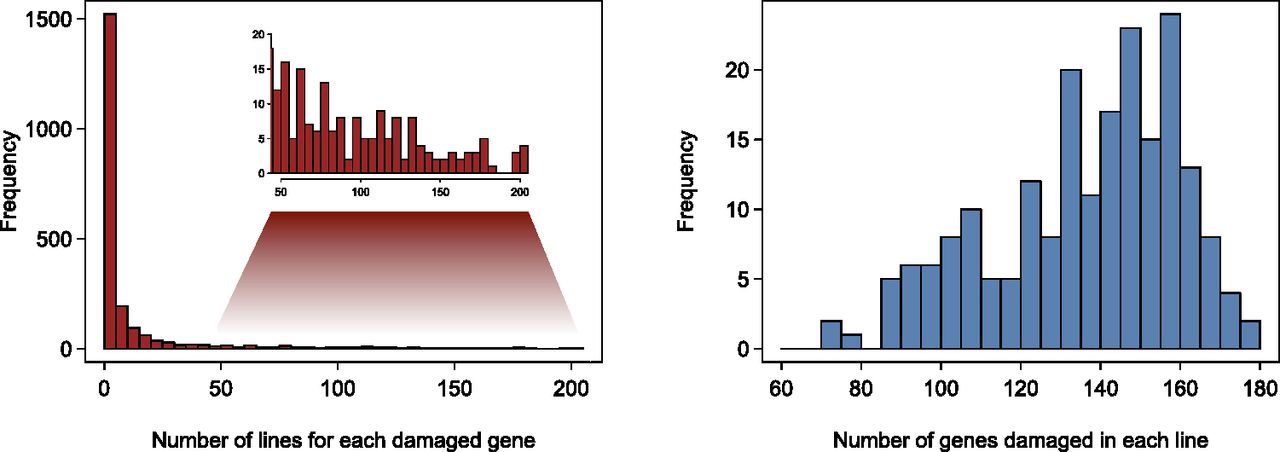
Histograms of the numbers of DGRP lines containing each damaged gene (left) and the number of damaged genes per DGRP line (right).
Histograms of the numbers of DGRP lines containing each damaged gene (left) and the number of damaged genes per DGRP line (right).