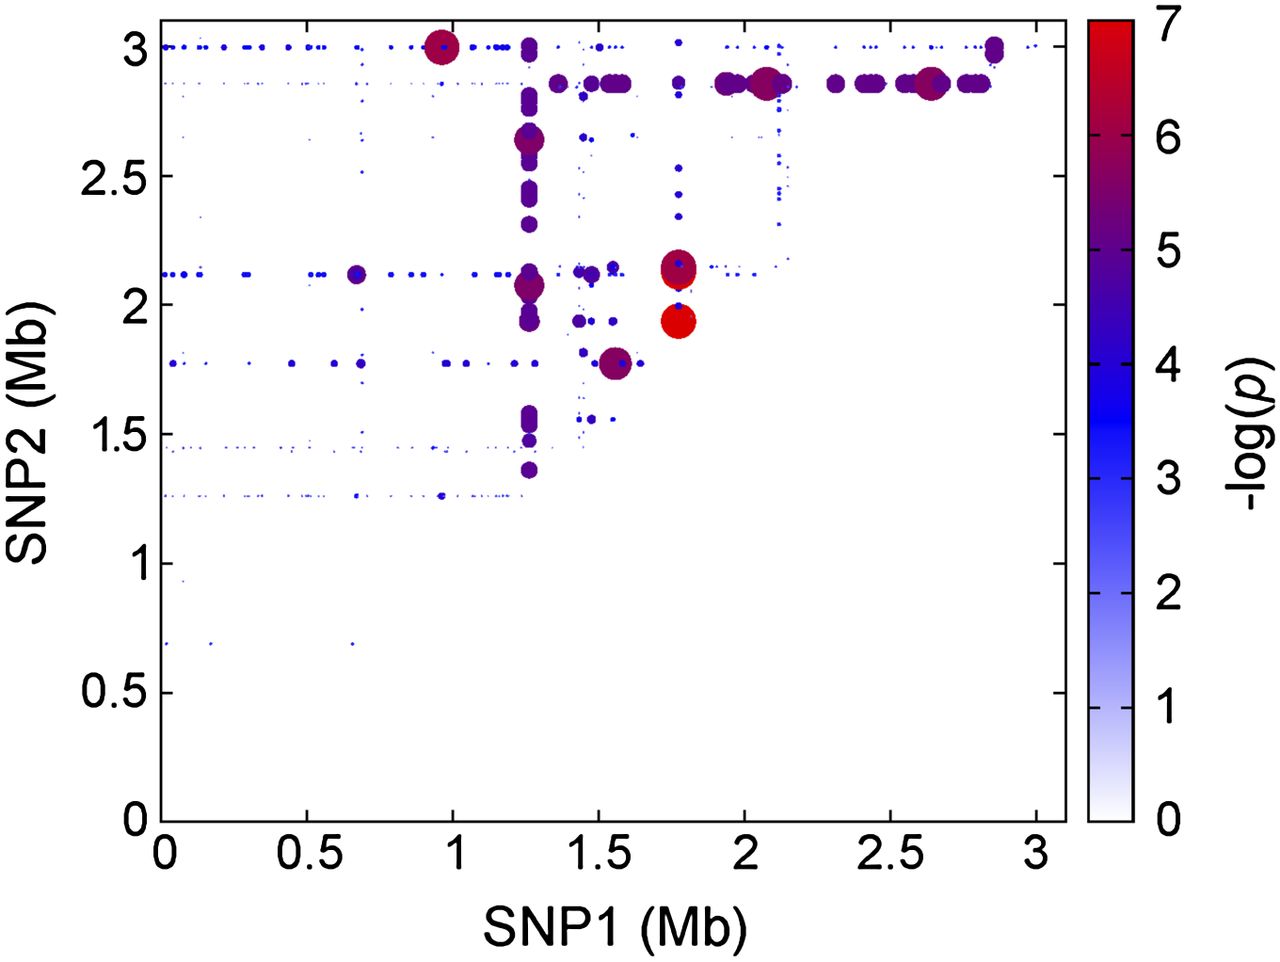
Figure 5.
Heat-map representing interacting SNPs conveying epistasis between SNPs that affects an isolate’s toxicity. Each SNP is represented on both the x- and y-axes with the origin of replication based at the intersection of the axes (at zero). The size and color of the spot represent the significance of the interaction between SNPs as illustrated by the colored bar.