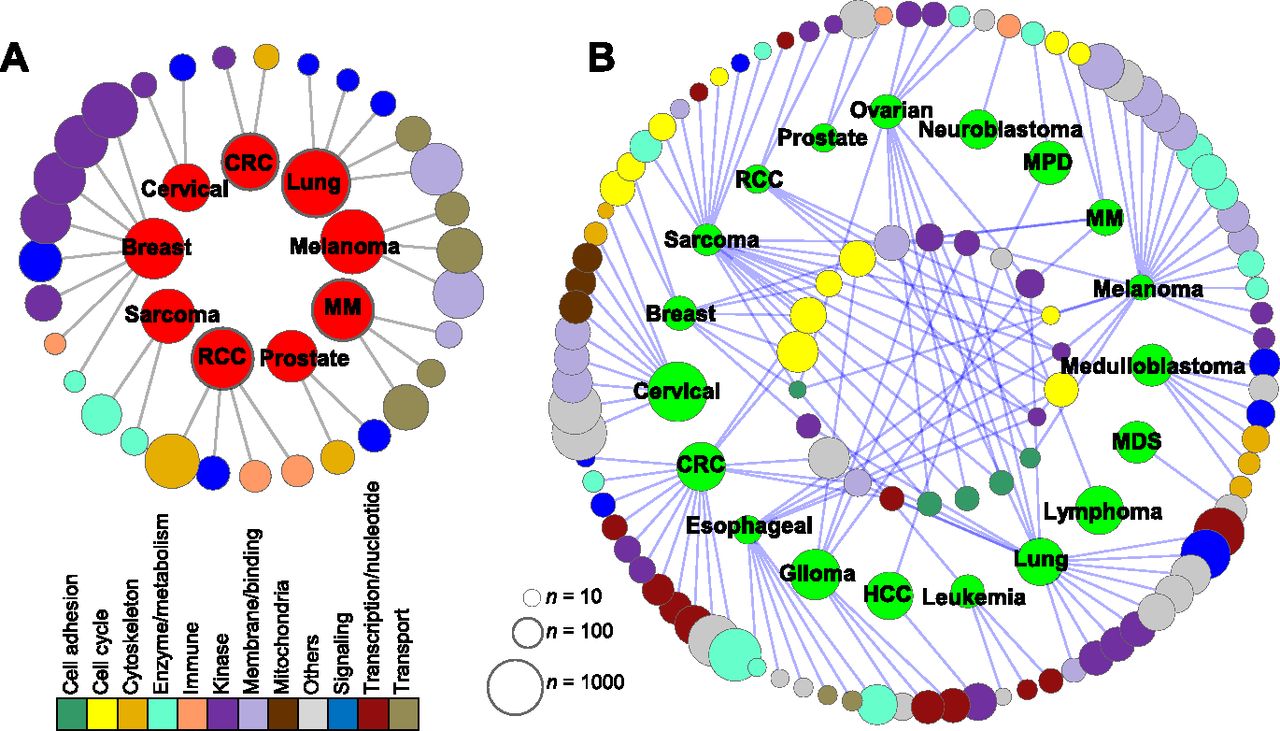
Functional association map of tumor type-specific alterations. (A) The genes belonging to tumor type-specific amplifications are shown as red nodes in a circular layout. (CRC) Colorectal cancer, (HCC) hepatocellular carcinoma, and (RCC) renal cell carcinoma. Significantly enriched GO categories are shown as nodes with different color schemes according to their functional annotations below. The size of each node is proportional to the number of genes in the gene set. (B) The association map of tumor type-specific deletions and their enriched GO categories is shown. GO categories associated with more than one tumor type and those with single connections are shown in and out of the cancer node circle, respectively. The full list of functional annotations and of individual GO categories and the genes responsible for the enrichment are available in Supplemental Table S5.