Figure 5.
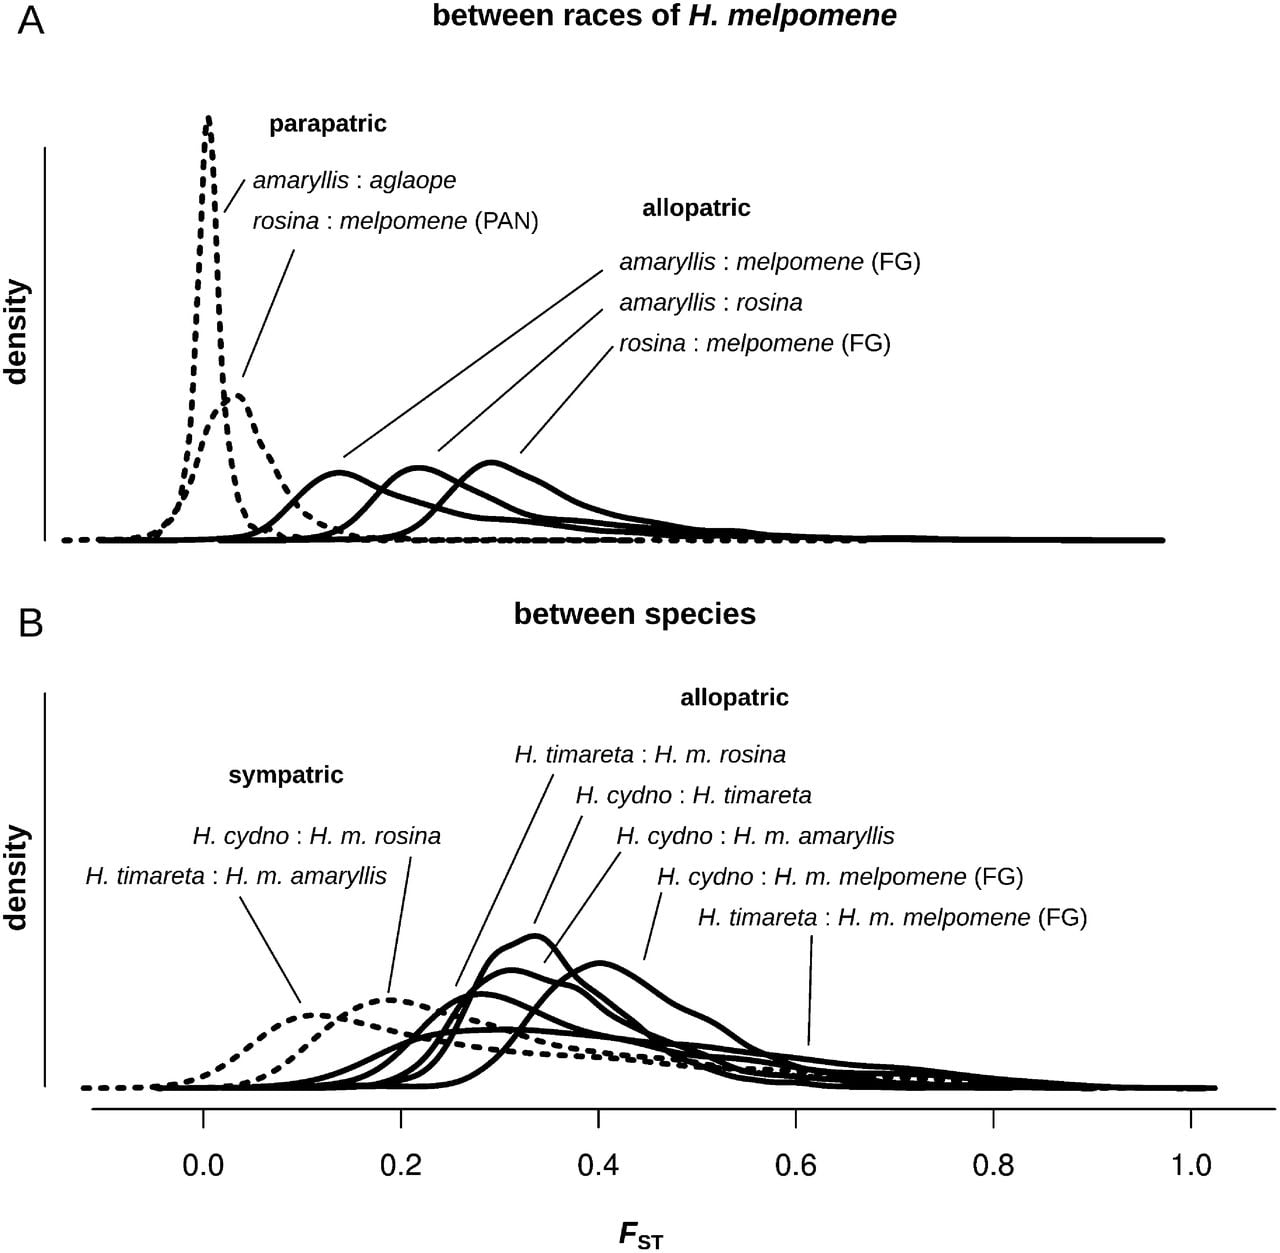
Density plots of pairwise FST values for non-overlapping 100-kb windows. All pairwise comparisons, corresponding to the plots in Figure 4, between races of H. melpomene (A), and between species (B).
Density plots of pairwise FST values for non-overlapping 100-kb windows. All pairwise comparisons, corresponding to the plots in Figure 4, between races of H. melpomene (A), and between species (B).