Figure 5.
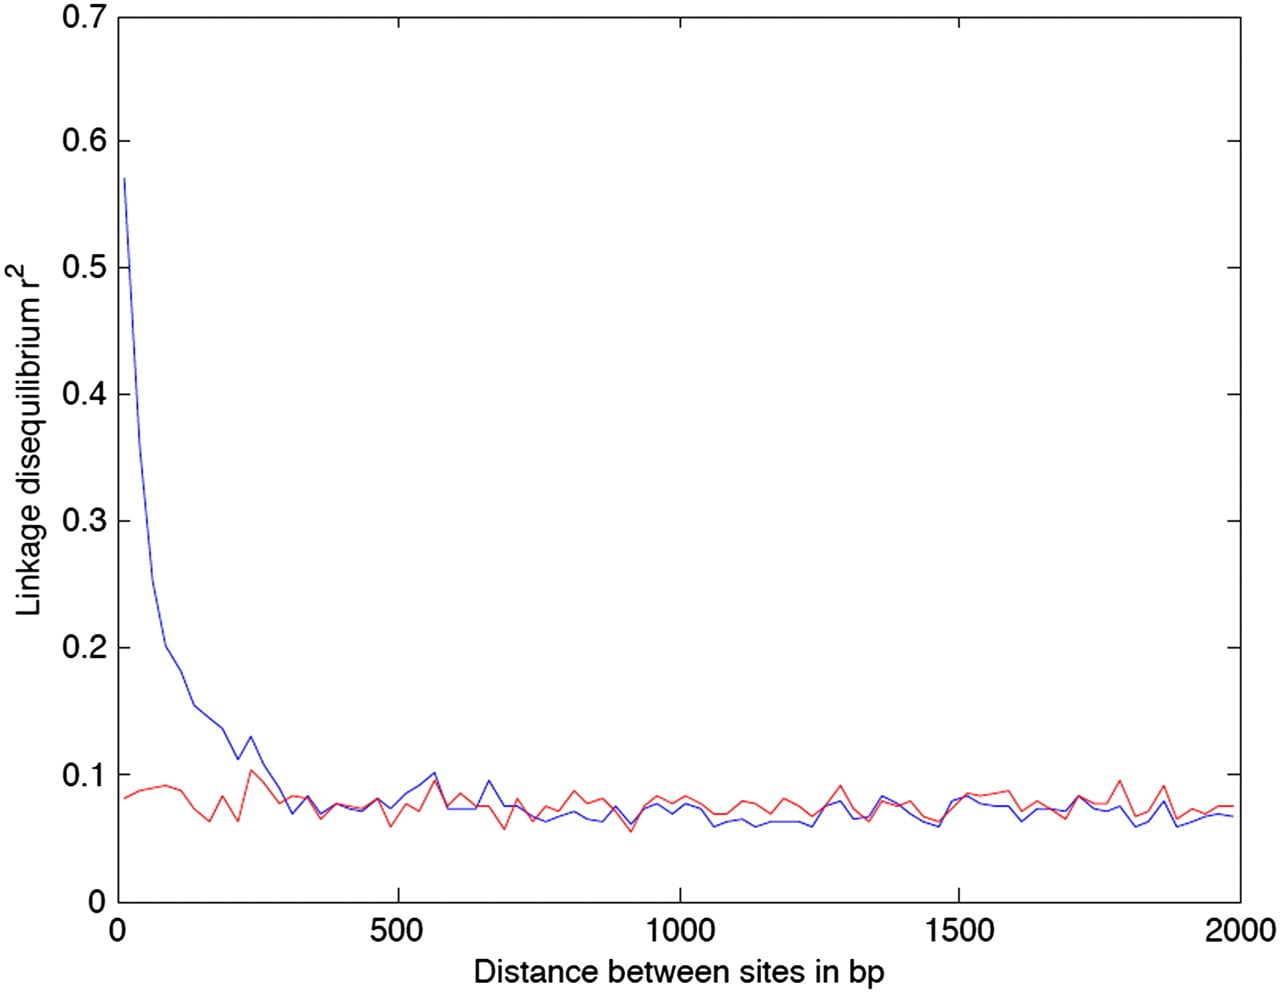
Relationship between linkage disequilibrium (y-axis) and genomic distance between pairs of SNPs (x-axis). (Blue line) LD computed using all SNPs; (red line) LD after excluding SNPs identified in recombination tracts.
Relationship between linkage disequilibrium (y-axis) and genomic distance between pairs of SNPs (x-axis). (Blue line) LD computed using all SNPs; (red line) LD after excluding SNPs identified in recombination tracts.