Figure 5.
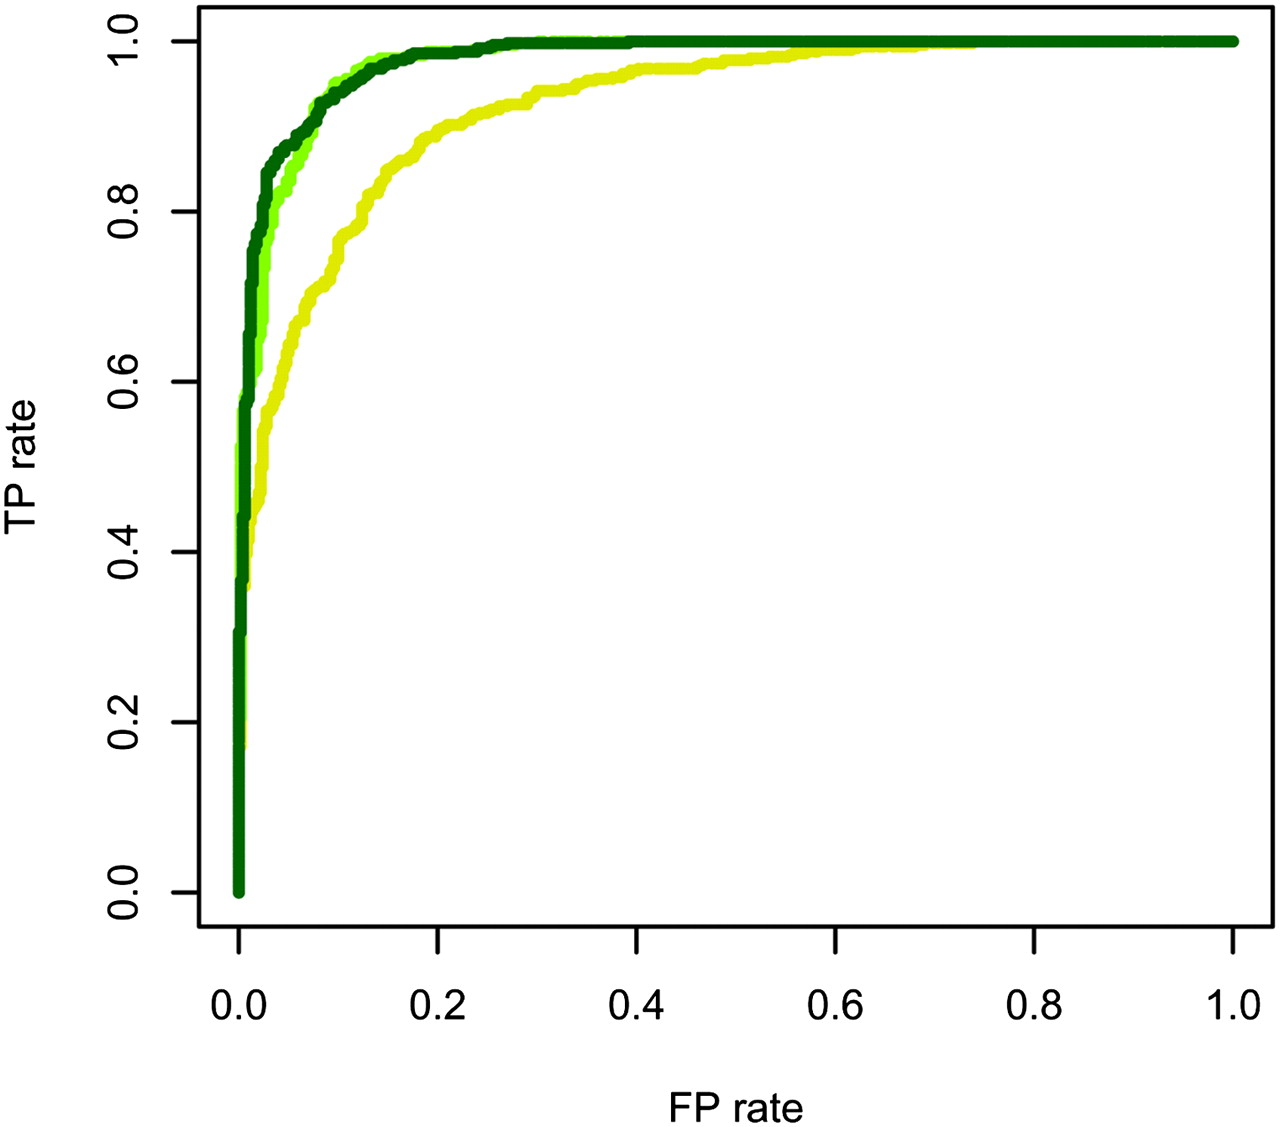
ROC curves for scenarios 4a, 4b, and 4c using the MCMC method. The curves for scenario 4a (dark green), 4b (light green), and 4c (yellow) were all calculated with an inference criterion of 95% SNPs detected.
ROC curves for scenarios 4a, 4b, and 4c using the MCMC method. The curves for scenario 4a (dark green), 4b (light green), and 4c (yellow) were all calculated with an inference criterion of 95% SNPs detected.