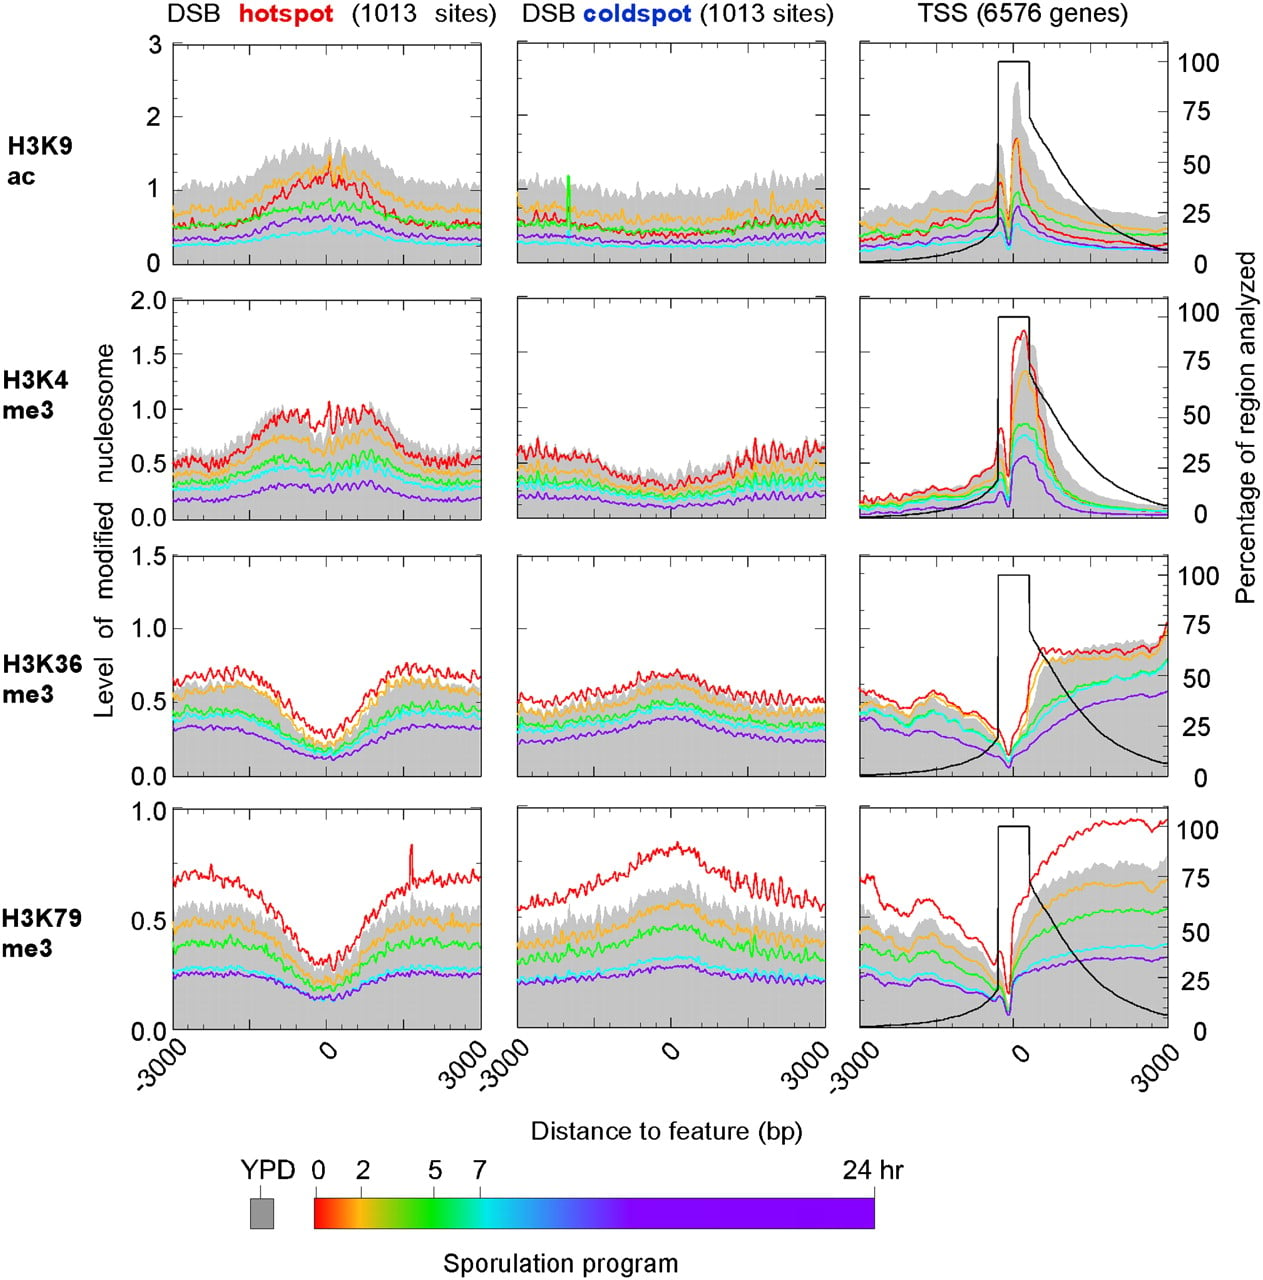
Figure 5.
Distribution of nucleosomes and histone modification states around meiotic recombination hot and cold spots. The distribution of nucleosomal tags and levels of the indicated modification states around double-strand break (DSB) hotspots and cold spots (Borde et al. 2009) during the sporulation program are displayed in the first two columns of graphs. To assess nucleosome densities, plots should be compared against Figure 2A. The third column displays tag distributions around the TSS as shown in Supplemental Figure S9B for comparison, but is highly smoothed to achieve the lower resolution of the DSB sites.