Figure 5.
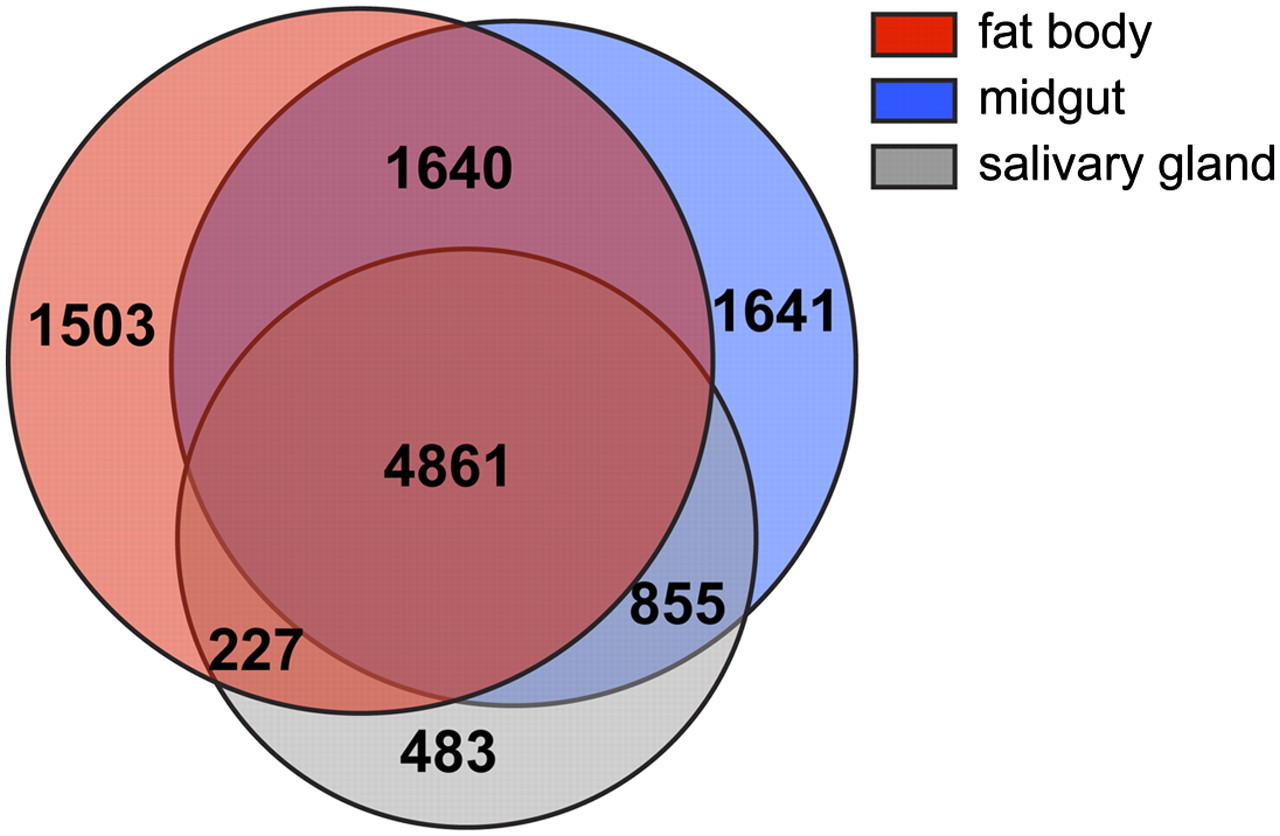
Tissue specificity of transcripts. Diagram illustrates the number of transcripts common to each tissue or the number of transcripts whose expression is shared between tissues.
Tissue specificity of transcripts. Diagram illustrates the number of transcripts common to each tissue or the number of transcripts whose expression is shared between tissues.