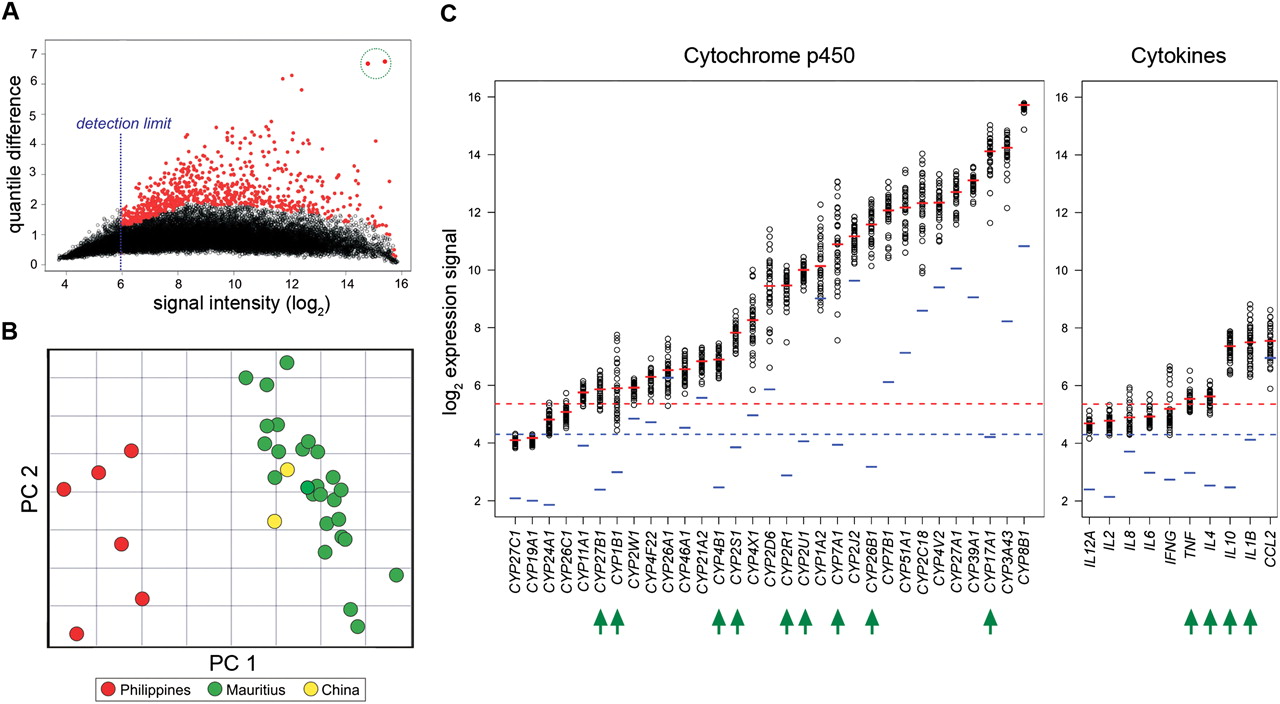
Microarray-based gene expression profiling in M. fascicularis. (A) Global variability of liver gene expression in 36 naive animals. Low-variance genes (LVGs; black dots) and high-variance genes (HVGs; red dots) were identified based on calculation of quantile differences of probe intensities. The 90% quantile of the log2 probe signal intensities is plotted on the x-axis, and the difference of the 90% and the 10% quantiles are plotted on the y-axis. The detection limit is marked by a dotted line. The metalloproteinase MT1B and the uridine phosphorylase 2 (UPP2) data points are denoted by a hatched green circle. (B) HVG-based clustering of animals according to geographical origin. Principal component analysis based on all HVG gene expression signals discriminates between animals from the Philippines (red dots) and animals from Mauritius (green dots) or a Chinese breeder (yellow dots). (C) Variability in baseline gene expression of cytochrome p450 isoforms and a panel of cytokines and response-related genes routinely used for drug safety assessment in humans. Scatter plots of expression levels (log2 values) of unambiguously annotated M. fascicularis cytochrome p450 genes (left) as well as key cytokines and the chemokine CCL2 (right). Data are sorted according to expression levels in ascending order from left to right. Black circles indicate the expression signals of individual animals. The mean expression signal per gene is depicted by red bars for M. fascicularis and blue bars for H. sapiens. The detection limit of the microarray platforms is indicated by dotted lines (red: M. fascicularis NimbleGen array; blue: Affymetrix human array). Green arrows denote differences in baseline expression levels in the two species.