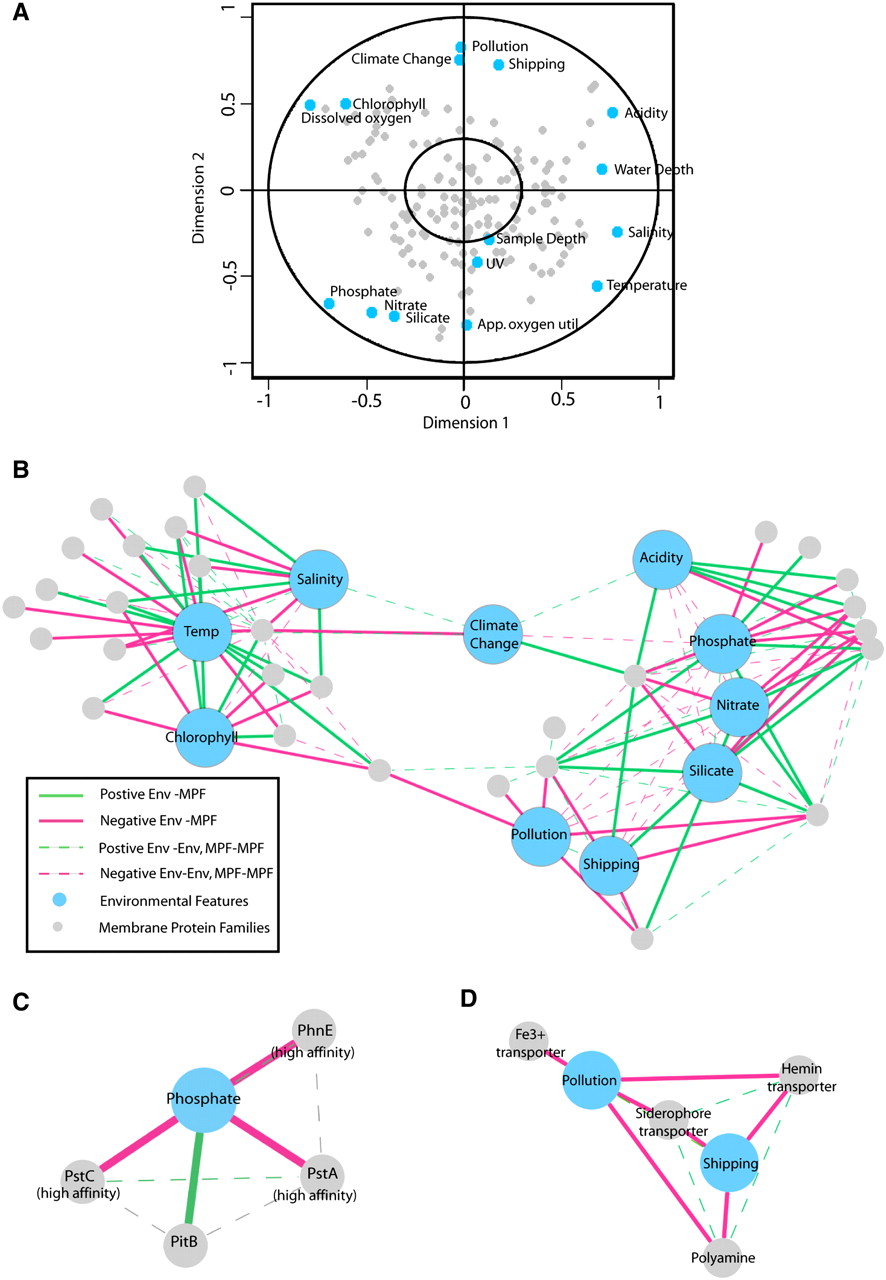
Figure 5.
(A) CCA structural correlations. Plot of first and second dimension of CCA with labeled environmental features (blue) and membrane protein families (gray). Within inner circle (0.3 circumference) features are invariant across the sites. (B) Membrane protein families and environmental features network. PEN construction from CCA structural correlations in the first and second dimension using a distance cutoff > |0.05| between all nodes (environmental features and membrane protein families). (Red edges) Negative associations; (green edges) positive associations. (C) Phosphate subnetwork. (D) Iron/polyamine subnetwork.