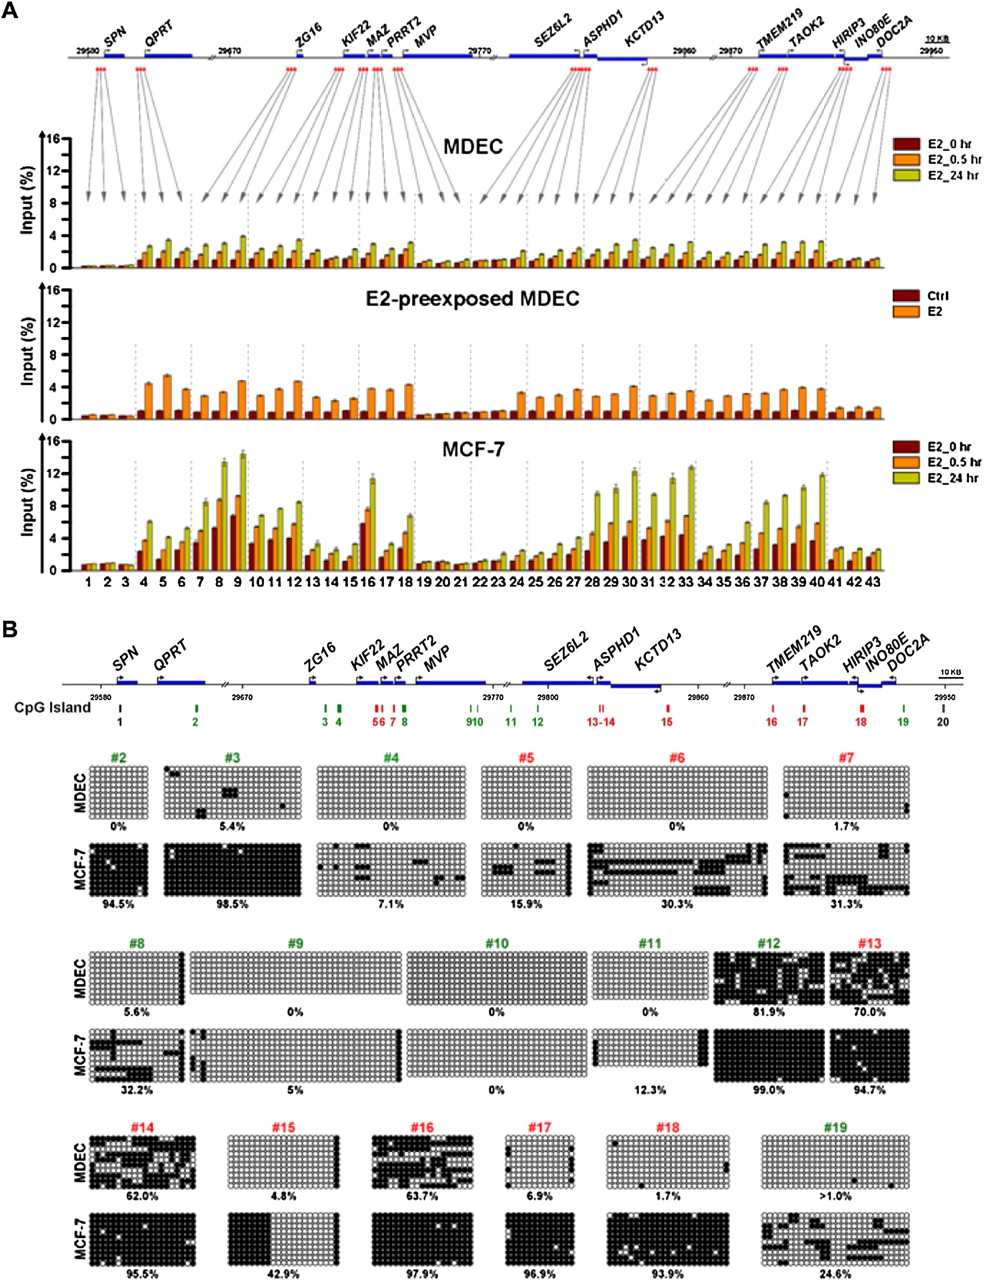
Epigenetic changes in the 16p11.2 region. (A) Distribution patterns of the repressive H3K27me3 mark in the 16p11.2 region. The diagram indicates the regions surveyed by ChIP-qPCR. The locations of interrogating regions (−3 to +1 kb of TSS) were labeled in red. DNA samples from E2-stimulated MDECs and MCF-7 cells and E2-pre-exposed MDECs were immunoprecipitated with anti-H3K27me3 antibody. Immunoprecipitated DNA was subjected to quantitative PCR to measure enrichment levels of H3K27me3. Mean ±SD (n = 3). (B) De novo DNA methylation analysis of CpG islands located on the 16p11.2 region. The diagram indicated the genomic locations of 20 CpG islands on the 16p11.2 region. The analyzed CpG islands (n = 9; nos. 5, 6, 7, 13, 14, 15, 16, 17, 18) located at the promoter and first exon regions of genes were labeled in red; other nonpromoter CpG islands (n = 9; nos. 2, 3, 4, 8, 9, 10, 11, 12, 19) were labeled in green. Two unanalyzed CpG islands were labeled in black. DNA methylation of 18 of 20 CpG islands located on the 16p11.2 region was surveyed by bisulfite sequencing. Primers flanking the cores of these CpG islands were designed for PCR amplification of bisulfite-treated DNAs from normal (MDEC) and cancer (MCF-7) cells. Ten clones per CpG island were selected for sequencing. (Black dot) methylated CpG dinucleotide; (white dot) unmethylated CpG nucleotide. Methylation percentage is calculated from the number of black dots to total dots in each sample.