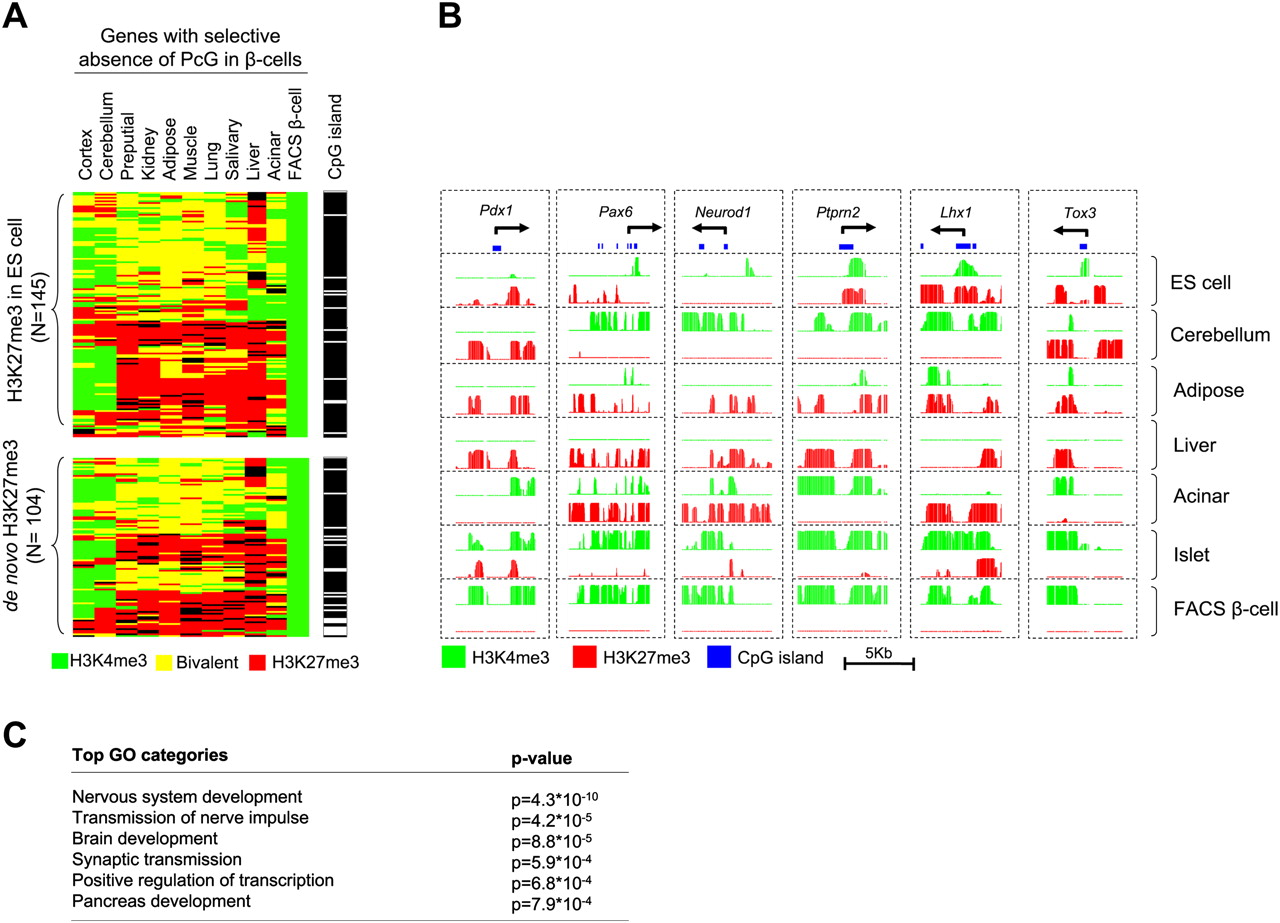
Figure 5.
A neural regulatory program shows selective absence of PcG repression in beta-cells. (A) A major fraction of genes with selective absence of PcG repression in beta-cells showed an identical pattern in cortex and cerebellum. The cluster diagram shows the 249 genes that are H3K27me3- H3K4me3+ in beta-cells but are H3K27me3+ in more than five other tissues. A quantitative analysis is shown in Supplemental Figure S6c. (B) Examples of genes with selective absence of PcG repression in beta-cells. (C) Most enriched nonredundant Gene Ontology biological process and molecular function terms (levels 4 and 5) among the 249 genes with beta-cell-selective absence of PcG repression. A more complete list is shown in Supplemental Table S8.