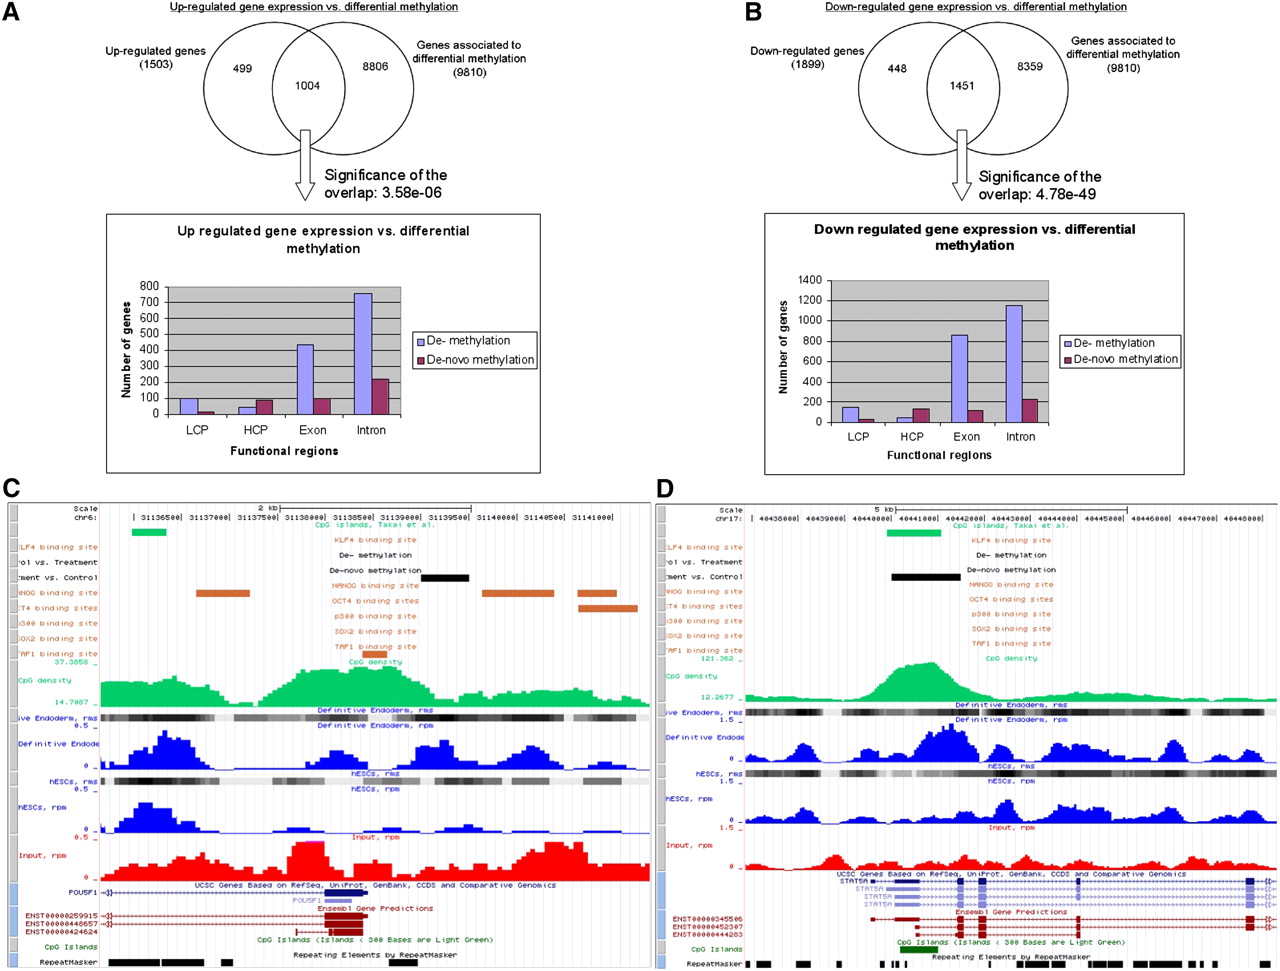
Genetic and epigenetic dependencies. The figure shows the number of up-regulated (A) and down-regulated (B) genes with respect to the number of genes associated with differentially methylated regions (DMRs). For the genes that are differentially expressed and that contain a DMR, the histograms give an overview of the location of the respective demethylated and de novo methylated regions (LCP indicates low CpG density promotor; HCP, high CpG density promotor). (C) The promoter region of the down-regulated TF POU5F1, including an identified promoter de novo methylation event. (D) The promoter region of the down-regulated TF, STAT5A, including an identified de novo methylation event. Visualization of both regions was done with a local copy of the UCSC Genome Browser (Kuhn et al. 2009) (hg19). Included tracks are rpm (blue curves) and rms (gray blocks) values for hESCs and DE, rpm values for input (red curves), demethylated and de novo methylated regions (black blocks), CpG islands defined by UCSC (dark green blocks at the bottom) (Kuhn et al. 2009) and by Takai and Jones (2002) (light green blocks at the top), CpG densities along the chromosome (green curves, calculated by MEDIPS based on the CpG coupling factors), TFBSs of six TFs (orange blocks; genomic regions were transformed from hg18 to hg19 using UCSCs liftOver software; Rhead et al. 2010) (Lister et al. 2009), repeat masked regions (black boxes at the bottom), and RefSeq (Pruitt et al. 2007) and Ensembl (Birney et al. 2004) transcripts.