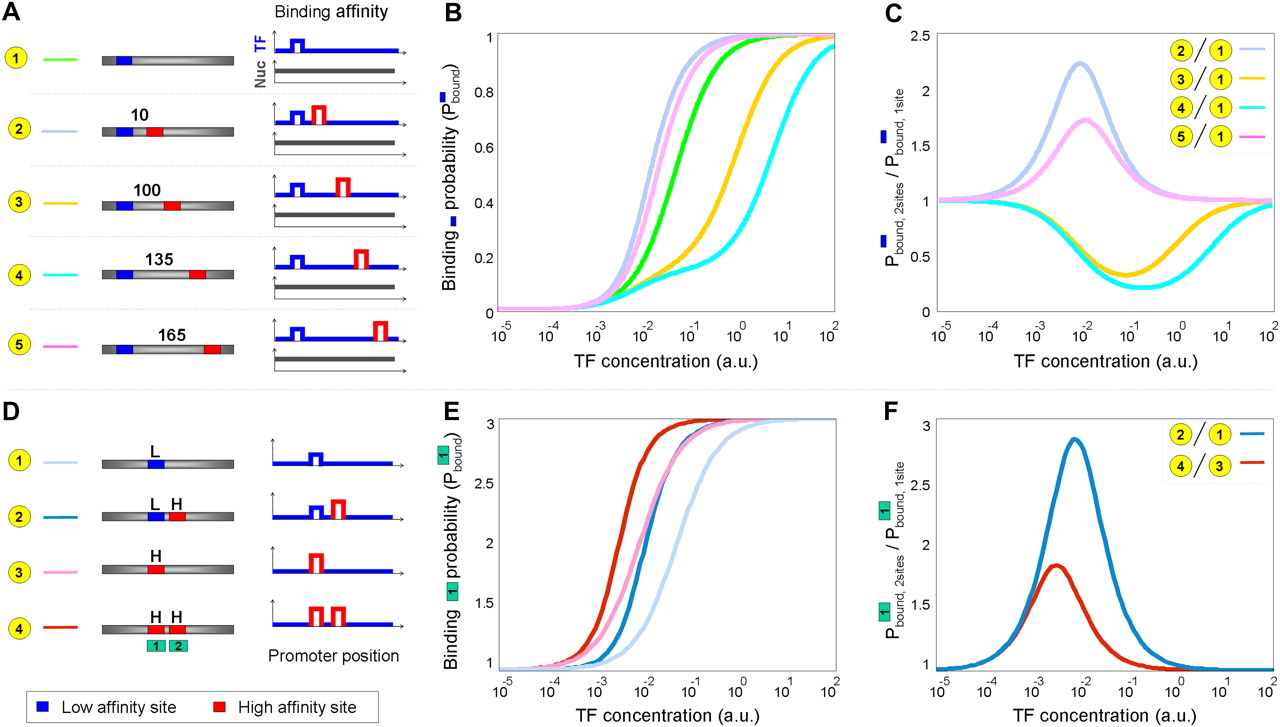
Addition of a transcription factor site to a simple promoter and its effect on the Pbound graph. (A) Illustrations of the promoters considered and the associated binding affinities for nucleosomes and transcription factors. (B) Shown are transcription factor binding probabilities to a low-affinity binding site for a simple promoter with a single low-affinity site (green), and for promoters with an additional high-affinity site located at various distances from the low-affinity site at increasing transcription factor concentrations. The addition of a transcription factor binding site can have both a cooperative effect (light purple and pink curves) and a destructive effect (yellow and cyan curves). Note that the addition of a transcription factor site results in a change in the shape of the activation curve. (C) Shown is the ratio between the probability of transcription factor binding to the low affinity site in a promoter with two transcription factor sites (Pbound,2sites) and in a promoter with one transcription factor site (Pbound,1site) at increasing transcription factor concentrations. This ratio can be viewed as the strength of the cooperative/destructive binding effect between the transcription factors (see main text). The ratio obtained changes as concentration increases and can be larger or smaller than one indicating a cooperative/destructive effect, respectively. (D–F) Examination of the cooperative effect generated by adding an adjacent high-affinity site to a promoter with a single, either low- or high-affinity, transcription factor site. (D) Illustrations of the promoters considered and the associated binding affinities for nucleosomes and transcription factors. (E) Transcription factor binding probability graphs for promoters with one high-affinity site (pink curve), two high-affinity sites (red curve), one low-affinity site (light blue), or one low-affinity and one high-affinity site (blue). The energetic contribution ( ) from binding is set to 1200 for a high-affinity site, and 200 for a low-affinity site. (F) Shown is the ratio between the probability of transcription factor binding to the left site (marked as site 1) in a promoter with two transcription factor sites (Pbound,2sites) and in a promoter with one transcription factor site (Pbound,1site) at increasing transcription factor concentrations. Note that the cooperative effect between a low-affinity site and a high-affinity site is larger than the cooperative effect between two high-affinity sites.