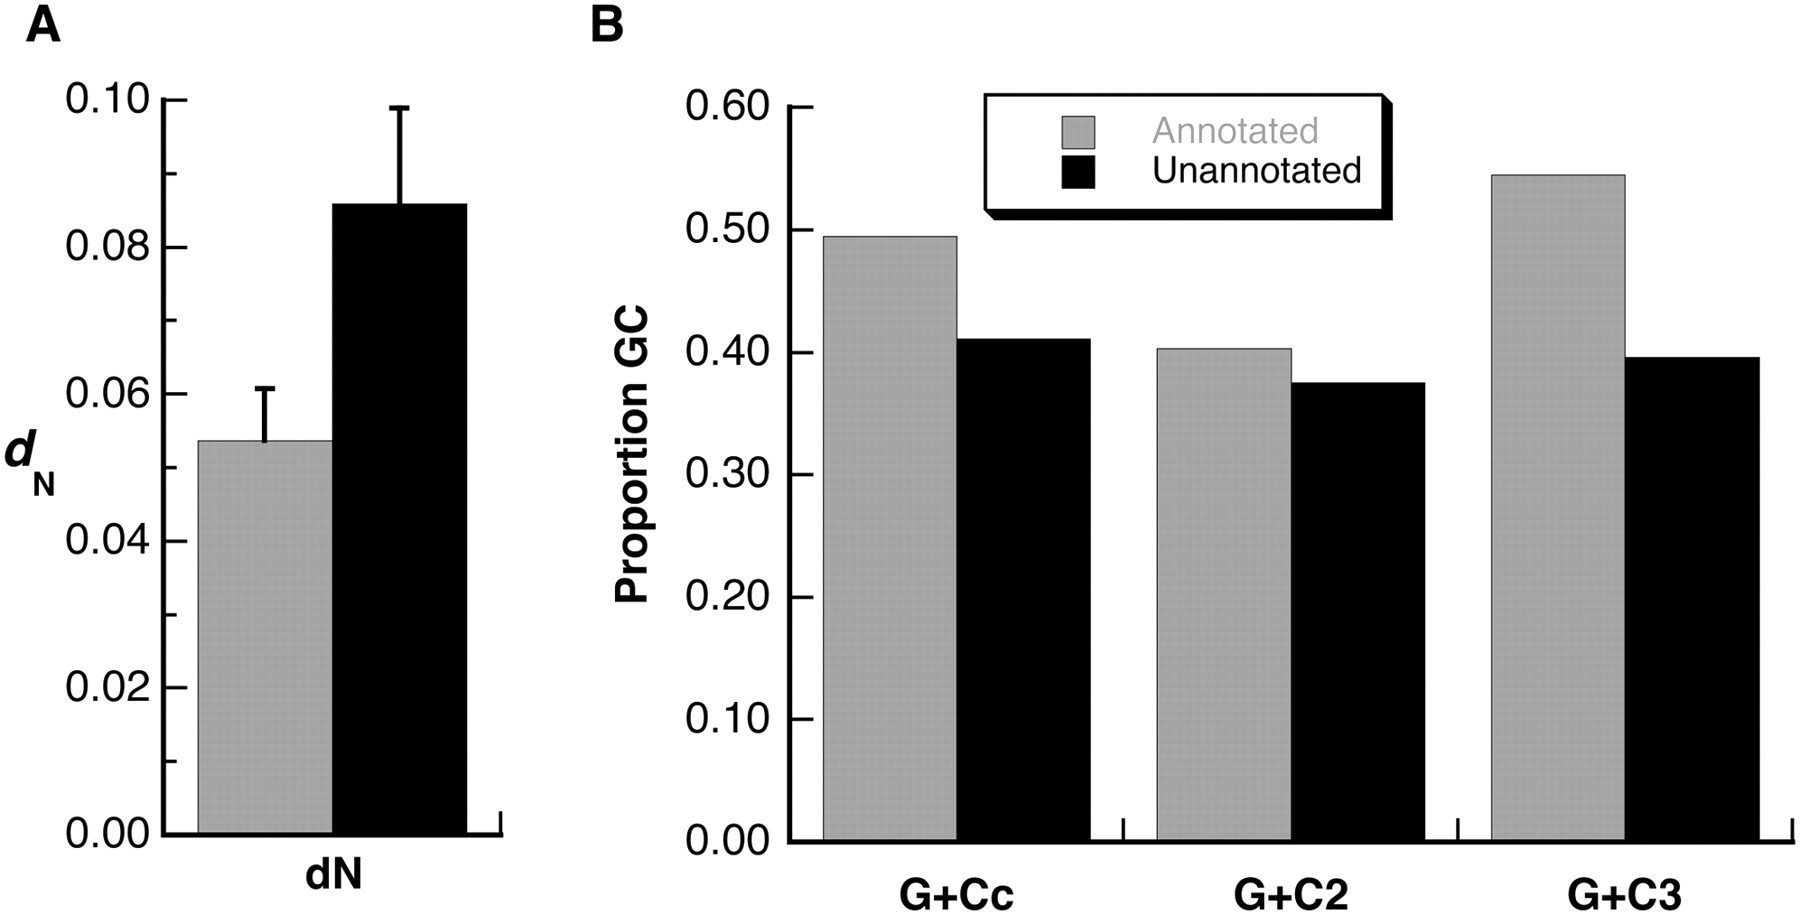
Figure 5.
Comparisons of annotated and unannotated transferred Sfps in D. melanogaster. (A) Mean values for annotated and unannotated genes for whole-gene, pairwise estimates of dN. Unannotated genes had a significantly higher rate of nonsynonymous substitution. Error bars, 1 SEM. (B) GC content for annotated and unannotated genes. G+Cc indicates overall GC content in coding regions; G+C2, GC content in second codon positions; and G+C3, GC content in third codon positions. For both panels, gray bars indicate annotated Sfps, and black bars indicate unannotated Sfps.