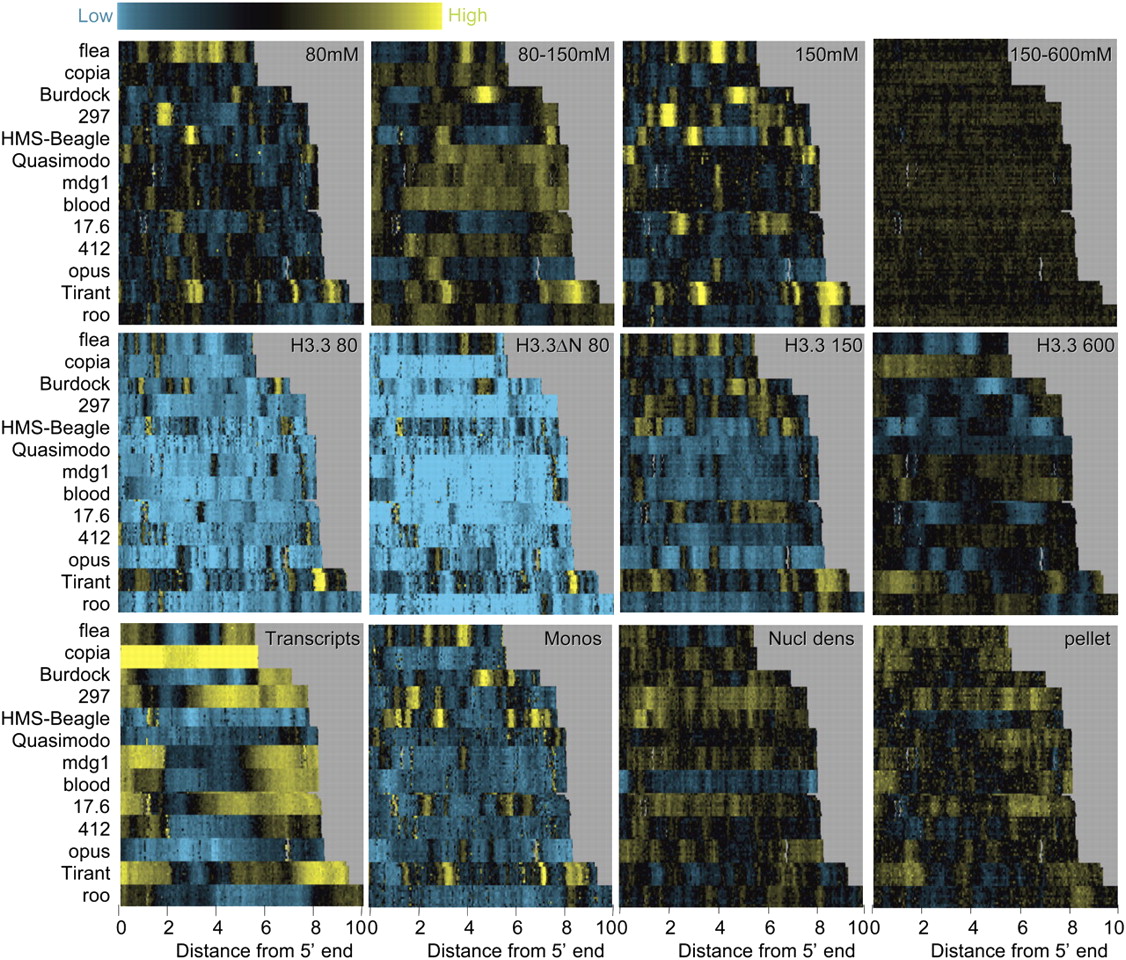
Enrichment of low-salt soluble chromatin locally within transposons. Heat map stacks of 13 transposon families for salt fractions, H3.3, mononucleosomes, nucleosome density, and cDNAs, showing single representative samples. (Top row) Successive salt-extraction fractions (versus MNased nuclei) for 80 mM, 80–150 mM, 150 mM, and 150–600 mM extracts. (Second row) H3.3/input levels for 80 mM, 80 mM H3.3ΔN, 150 mM, and 600 mM pulldowns. (Third row) cDNA/genomic DNA from poly(A)+ RNAs, gel-purified mononucleosomes/input bulk DNA, MNased nuclei/genomic DNA, and pellet/nuclei after a 600 mM wash. Vertical gray streaks, most noticeable in the 600 mM stack, result from alignment gaps. Contrast levels are equal for all stacks (Java TreeView setting of 3.0).