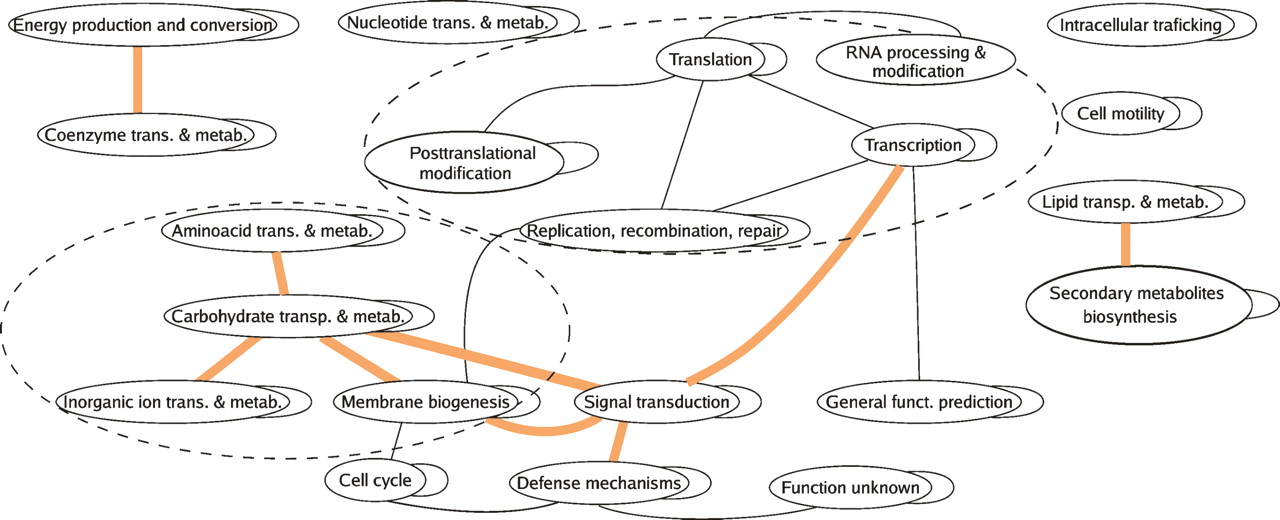
Network of coevolutionary relationships between functional categories. Links are P = 0.05 significant coevolutionary relationships between COG functional categories. Significance is calculated in relationship to an ensemble of 2500 randomized coevolutionary maps (see Methods). The colored lines correspond to links found only with partial correlation and not with sign score. The rest of the links are found both by sign and partial correlation scores. Dotted circles enclose information processing and carbohydrate metabolism modules. Most of the underlying coevolutionary relationships relate to the cases shown in Fig. 4 e.g., antimicrobial peptides (defense mechanisms) and uncharacterized signal transduction families, TonB outer membrane receptors (ion transport), and metabolism of sugars, etc.