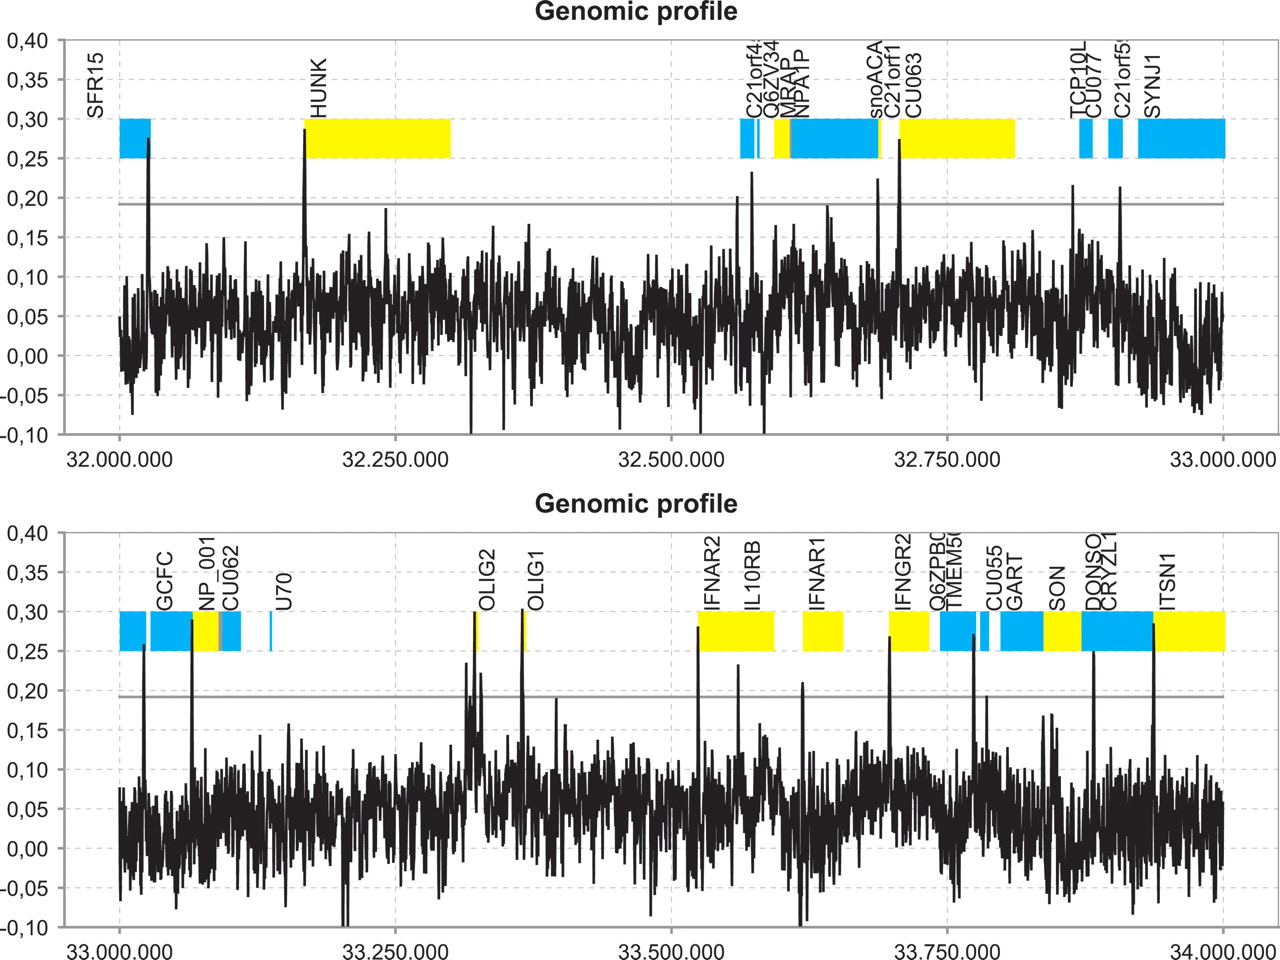
Figure 5.
Structural profile (blue) of human chromosome 21 between position 32,000,000 bp and 33,000,000 bp. The profile, based on inverted base-stacking values, was made using a window size of 400 bp and using nonoverlapping windows. Experimentally annotated genes from Ensembl are indicated: (yellow bands) positive strand; (blue bands) negative strand. Peaks in the profile that exceed the classification threshold (T = 0.19, horizontal gray line) are predicted as promoter regions. (X-axis) Position in the genomic sequence, (Y-axis) inverse of the value for base-stacking energy. The labels on the plot show the gene names as they appear in Ensembl.