Skip to main content
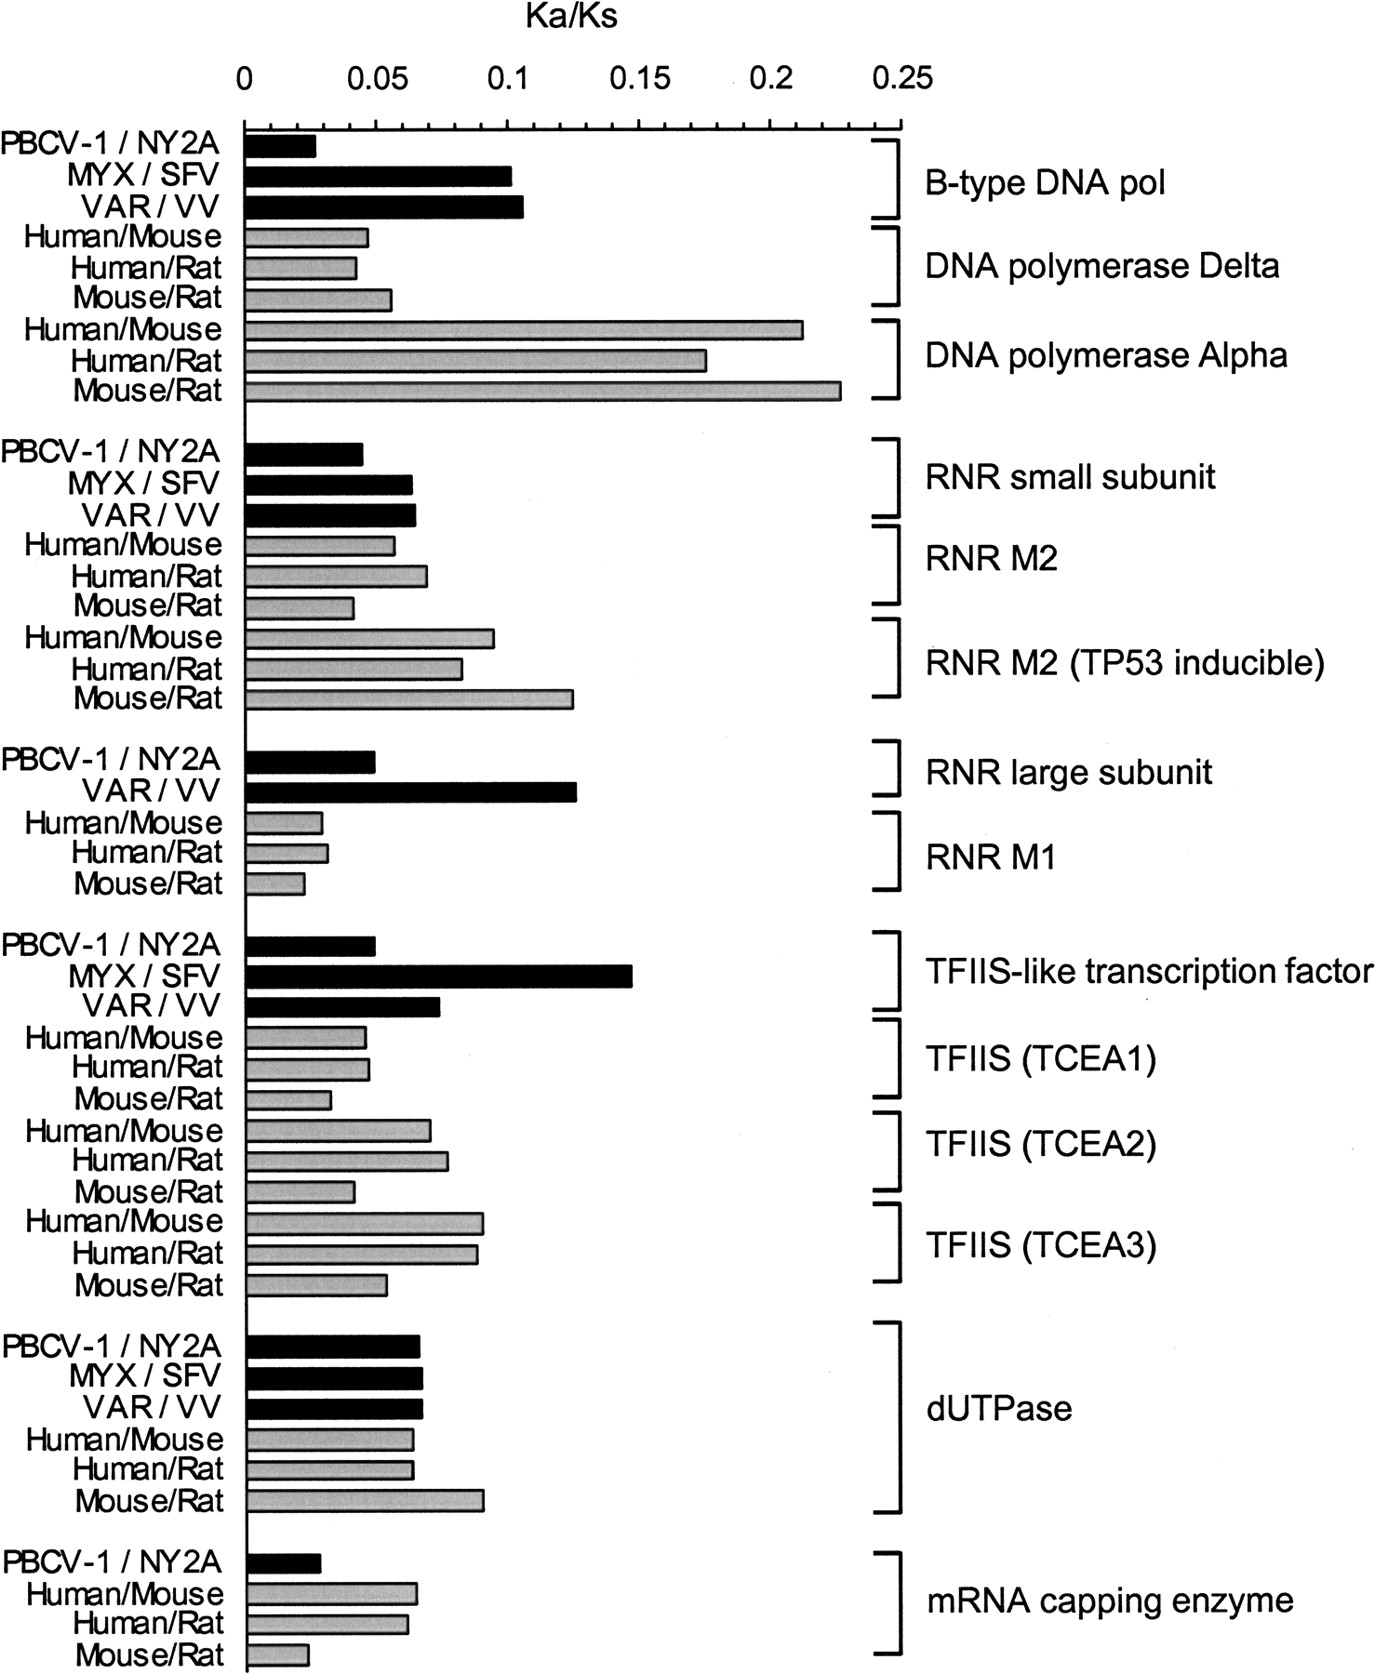
Figure 5.
Comparisons of
K
a
/
K
s
values between NCLDV genes and vertebrate homologs.