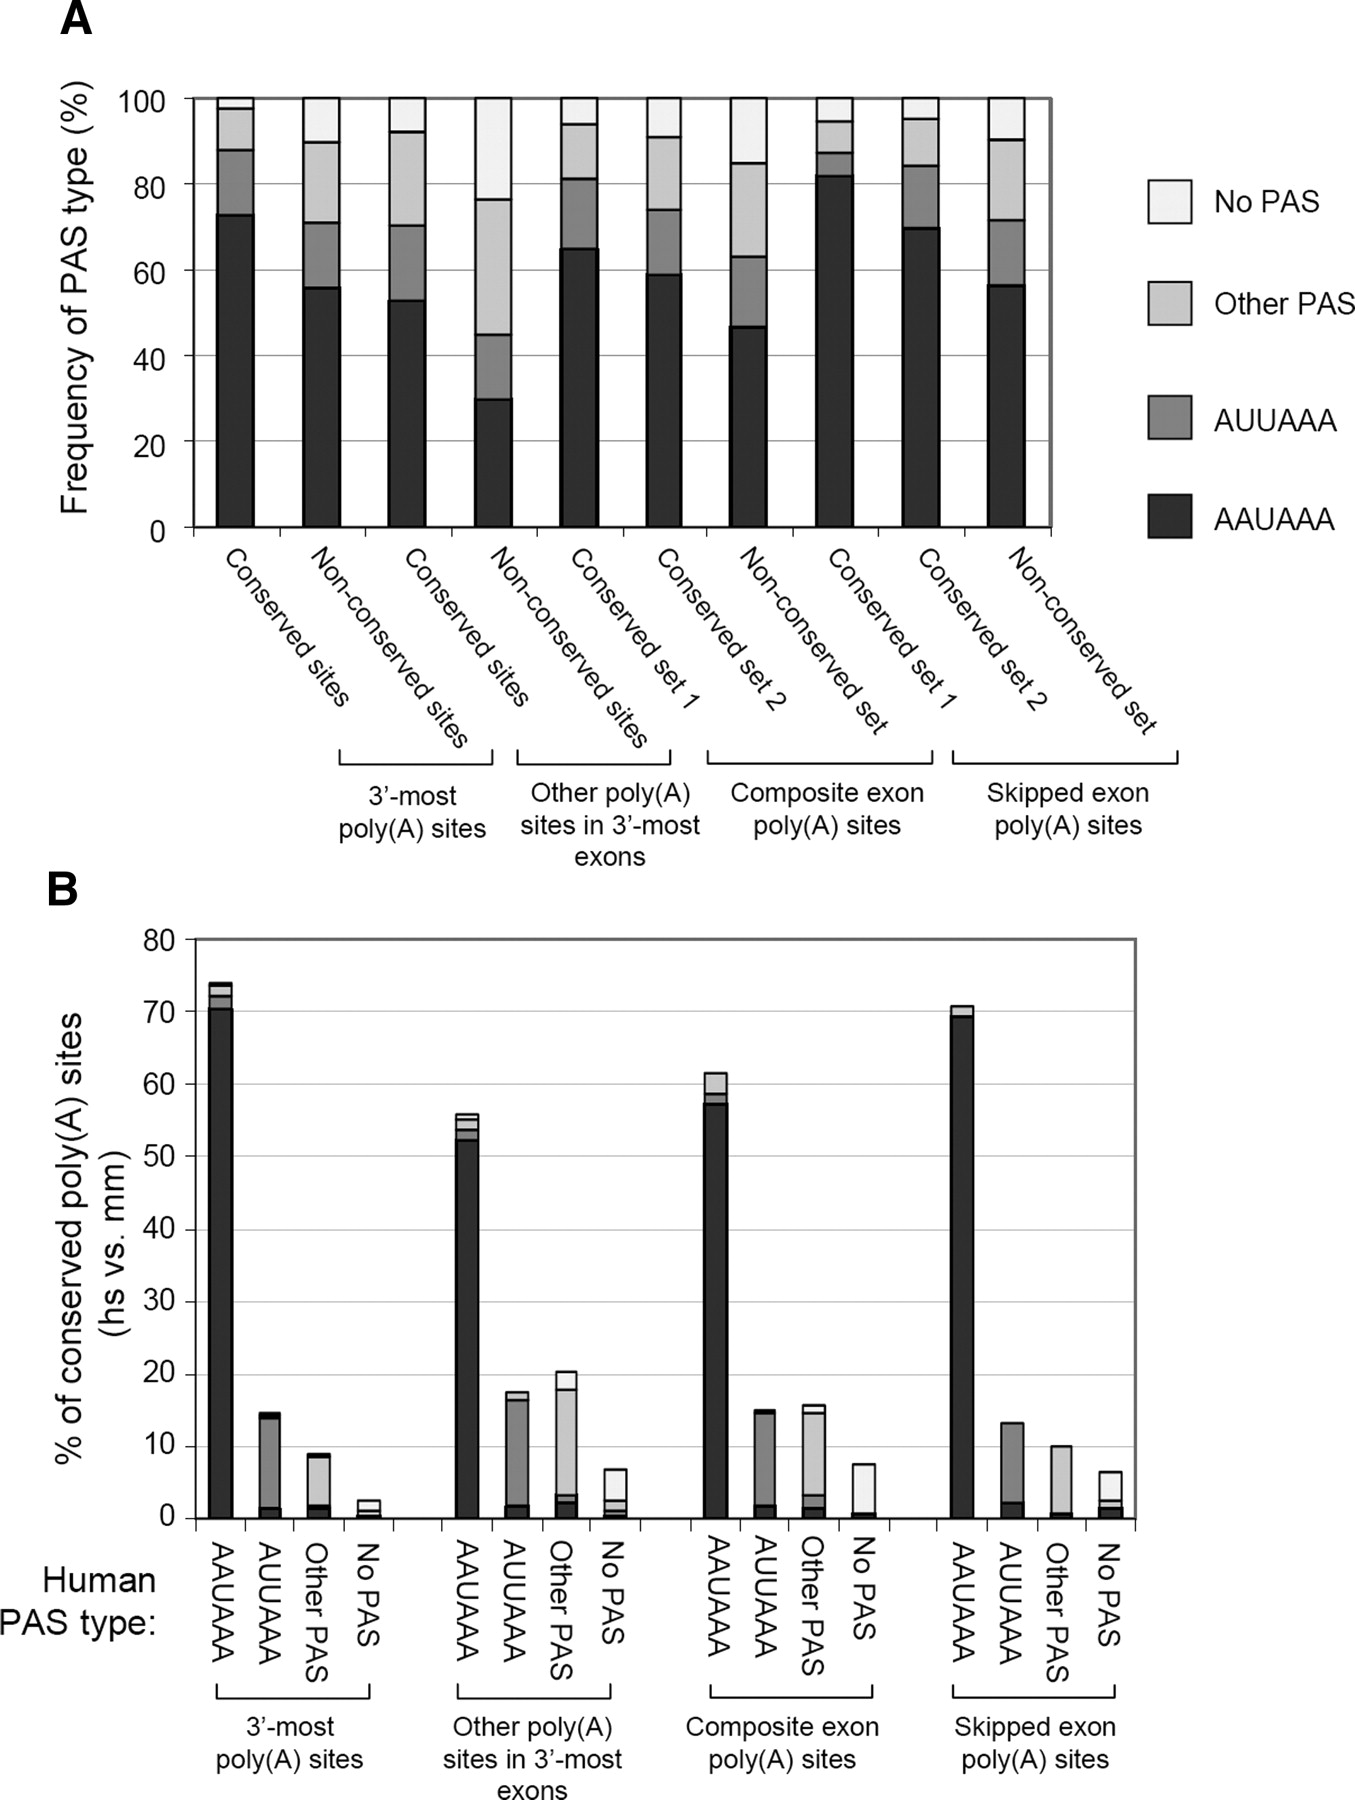
PAS hexamer frequency and conservation for different types of poly(A) site. (A) Frequency of four types of PAS hexamers in 10 groups of poly(A) site. Poly(A) site types are indicated at the bottom of the graph. The −40 to −1 nt region was used for identifying PAS hexamers. Other PAS corresponds to any one of the 11 variants of AAUAAA (for details, see Methods), and no PAS indicates that no PAS hexamers can be found in the –40 to –1 nt region. (B) Conservation of PAS type between human and mouse orthologous poly(A) site pairs. Conserved sets were combined for composite exon poly(A) sites and skipped exon poly(A) sites. Each bar represents the percentage of conserved poly(A) sites having a given PAS type (indicated below the bar) in a human poly(A) site group (indicated at the bottom of the graph). Thus, the sum of four bars for a poly(A) site group is one. Each bar contains four areas, representing the frequency of four PAS types for the corresponding mouse sites.