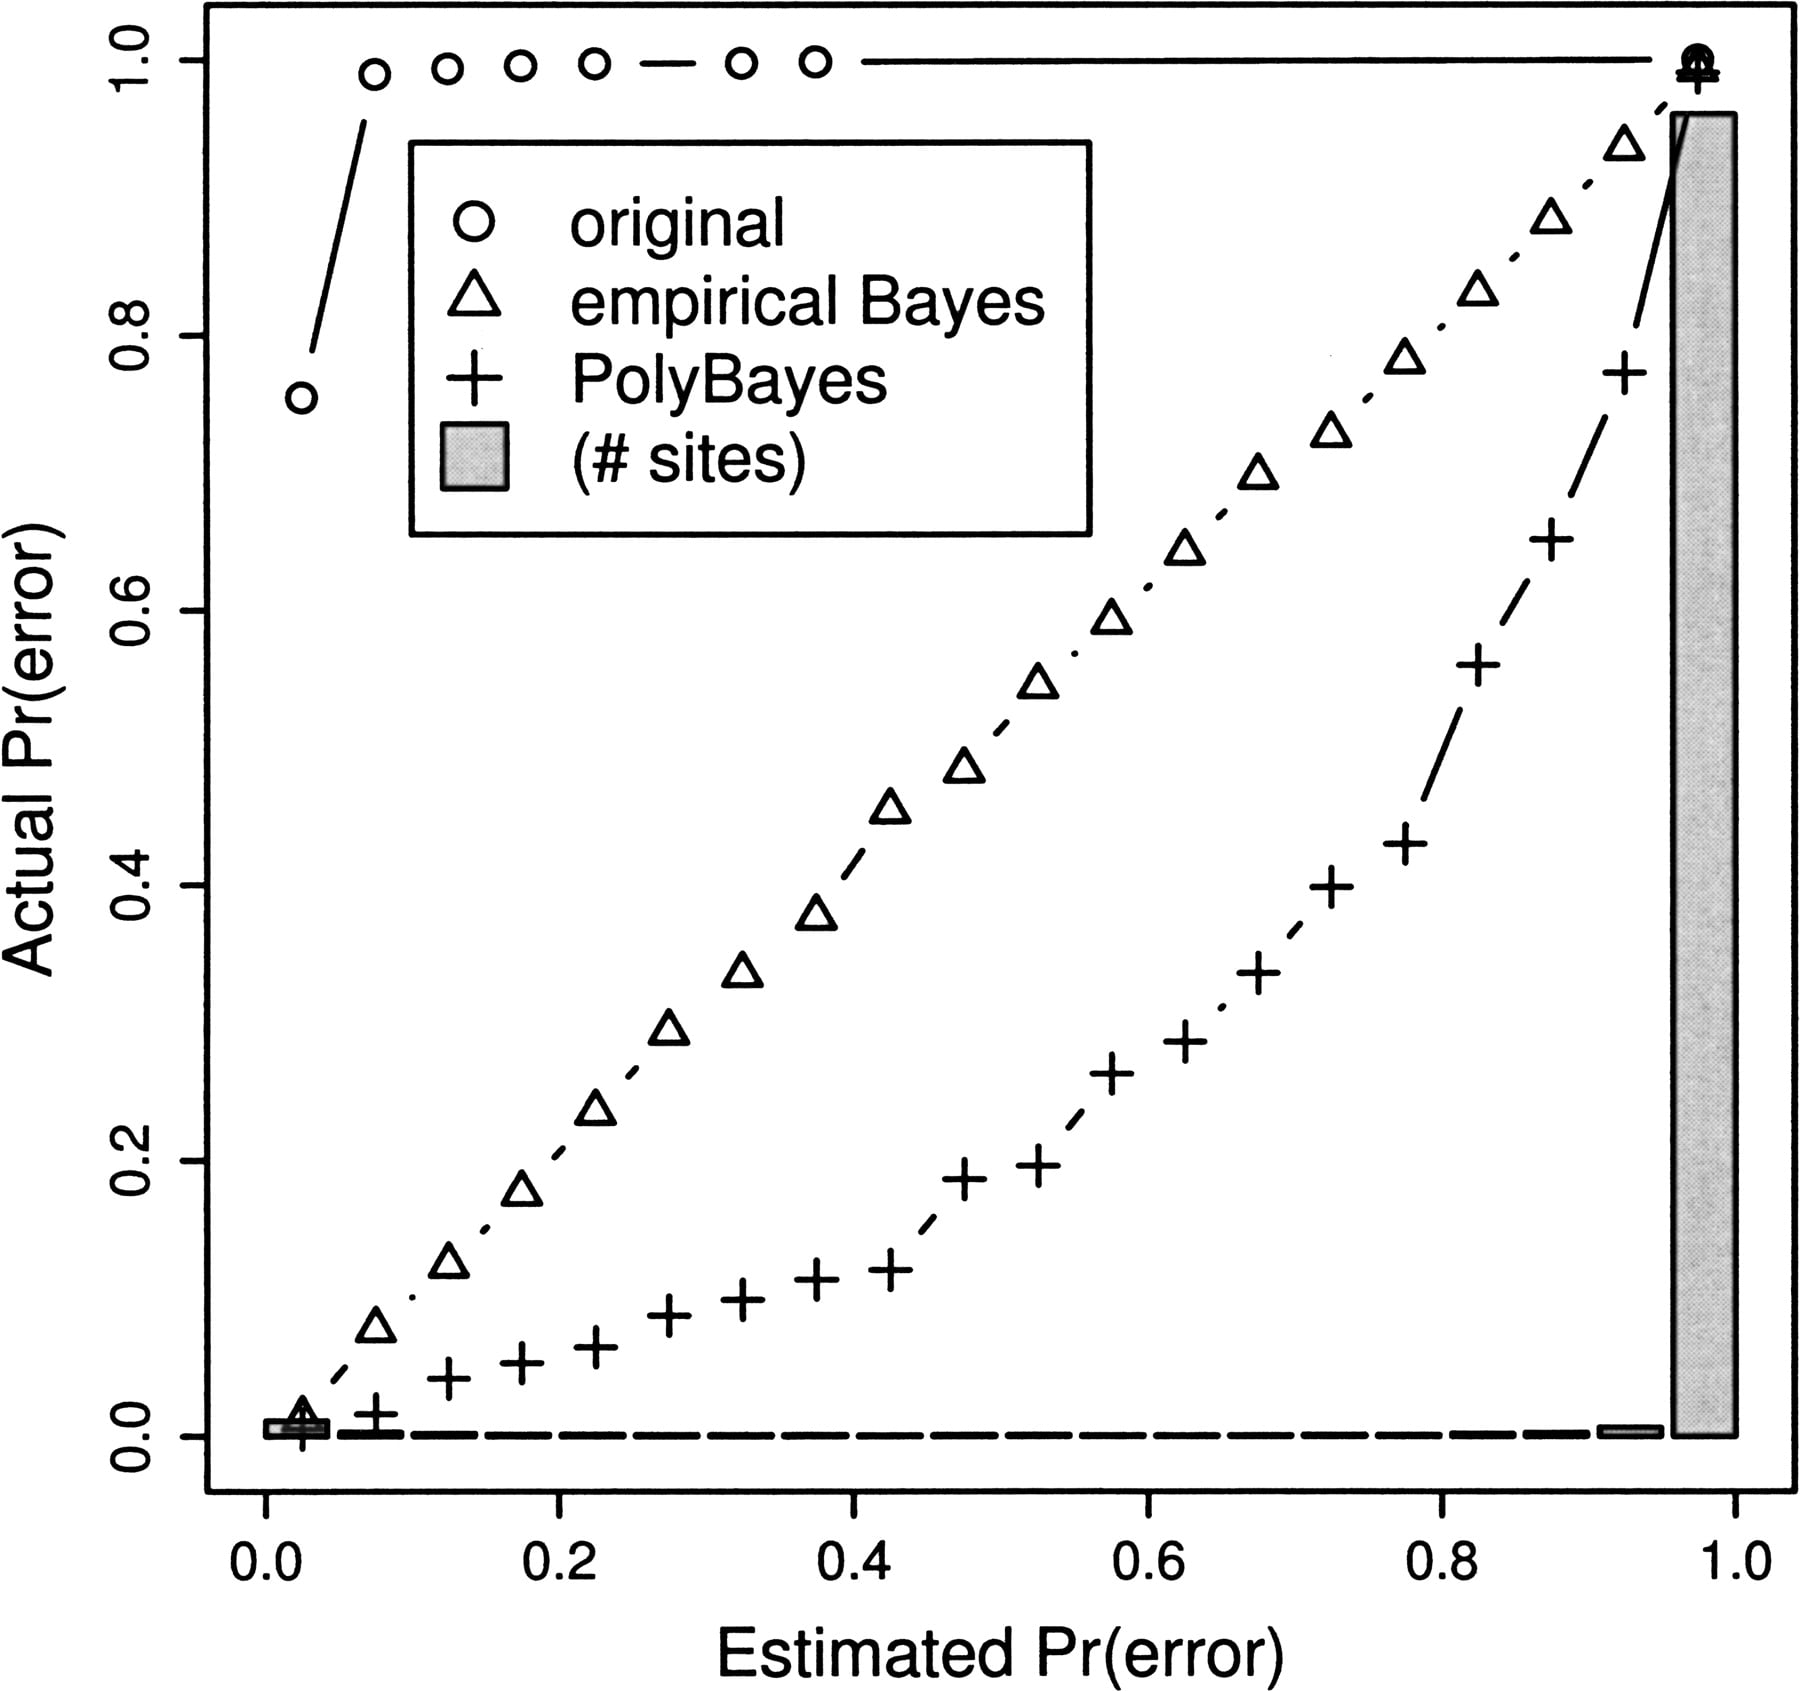
Figure 5.
Comparison of original quality score, PolyBayes, and our empirical Bayes quality score (folded spectrum) for apparently singleton polymorphic positions. Sites are binned according to quality score along x-axes and true rates of error (known from simulation) are plotted on the y-axis. Gray bars show distribution of PolyBayes estimated probabilities of error.