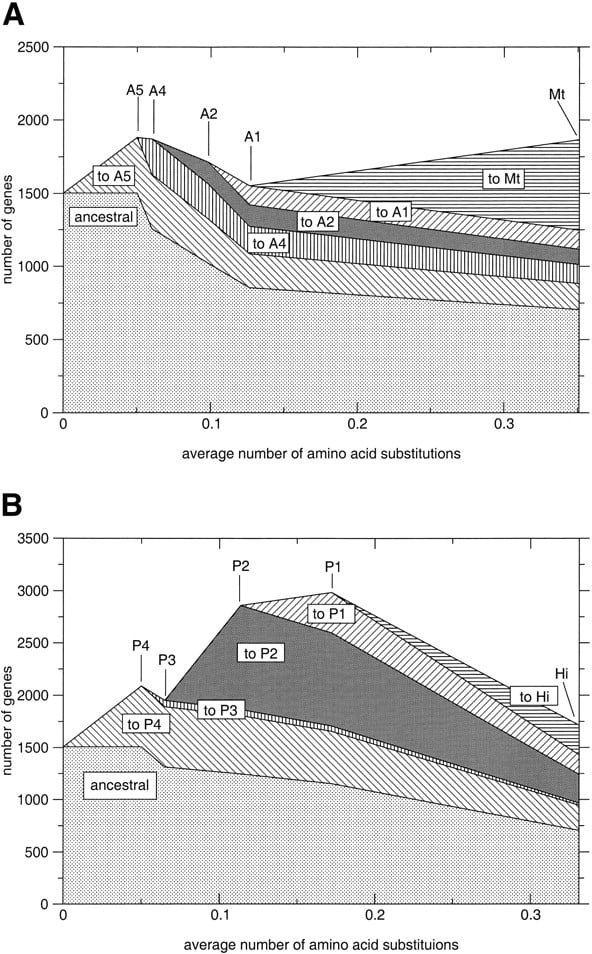
A genome history. The plot traces the lineage leading to a present day genome through time; that is, the events on the successive branches are plotted sequentially over the evolutionary time of the branches. Between all nodes the number of genes that is gained (i.e., gene genesis + gene duplication + horizontal gene transfer) leading to a node is plotted, and this set is marked. For each set stemming from a certain node/branch, the number of genes left in the succeeding nodes is traced, thereby denoting which genes are lost. The evolutionary time between the “root” and the common ancestor of the Archaea or Proteobacteria is unknown; we therefore used a fixed arbitrary distance for that branch lengths. (A) shows the lineage leading toM. thermoautotrophicum at an HGT penalty of 2. (B) shows the lineage leading to H. influenzae at an HGT penalty of 2.