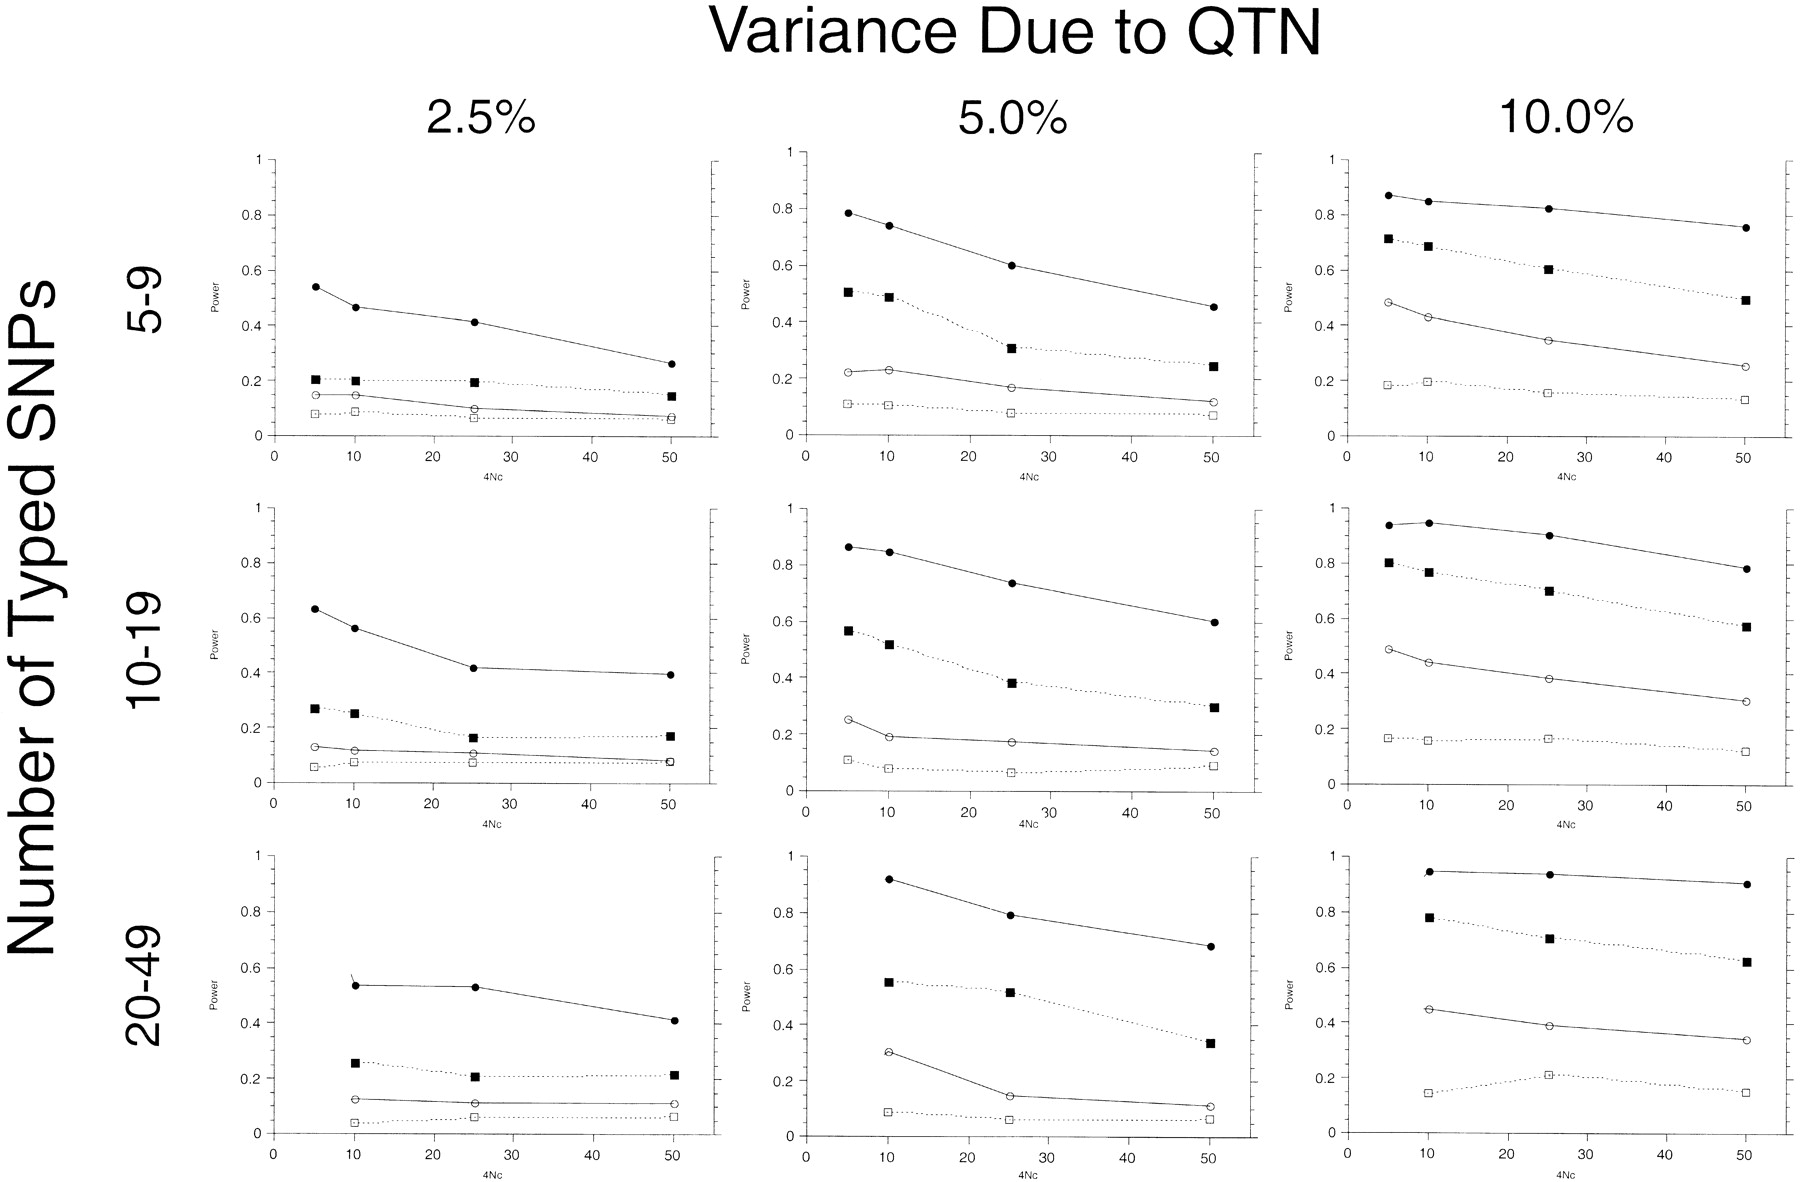
Figure 4.
The power of detecting an association between SNPs and variation in a quantitative trait for DMP and TDT-Q5 statistics. Circles represent the DMP; squares represent the TDT-Q5 test statistic. Open symbols are for 100 individuals examined; solid symbols are for 500 individuals examined.