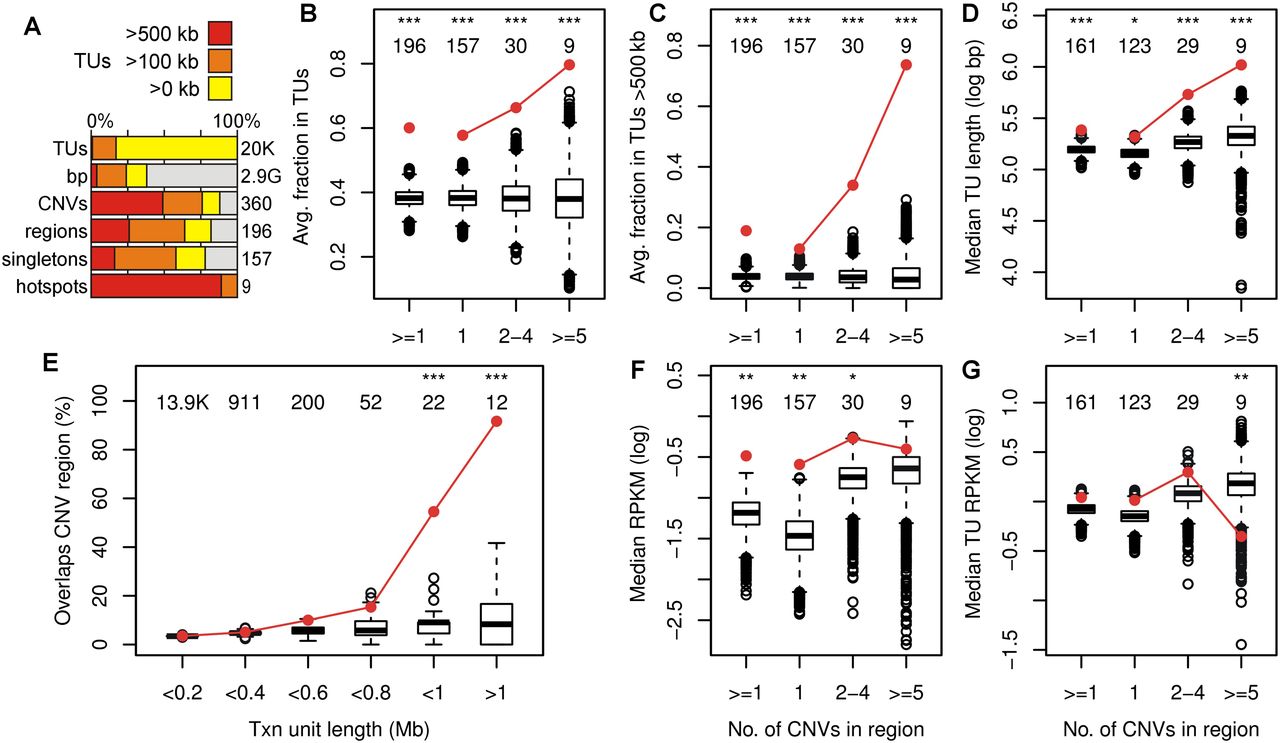
CNV hotspots correspond to active large transcription units. (A) Rows represent the total number of TUs, bp, CNVs, CNV regions, singleton CNVs, and hotspots in the mappable genome for human 090 fibroblasts. Colors indicate the percentage that overlapped TUs > 500 kb, > 100 kb, or any length. (B–D) 090 CNV region enrichment plots for the fraction in Bru-seq TUs, fraction in TUs > 500 kb, and length of the longest overlapped TU, respectively, similar to Figure 3B. (E) 090 TU enrichment plot for the percentage of TUs that overlapped one or more CNVs. (F,G) 090 CNV region enrichment plots for the region’s Bru-seq RPKM and RPKM of the most highly expressed and overlapping TU, respectively. See Supplemental Figures S5 and S6 for mES cell and additional enrichment plots.