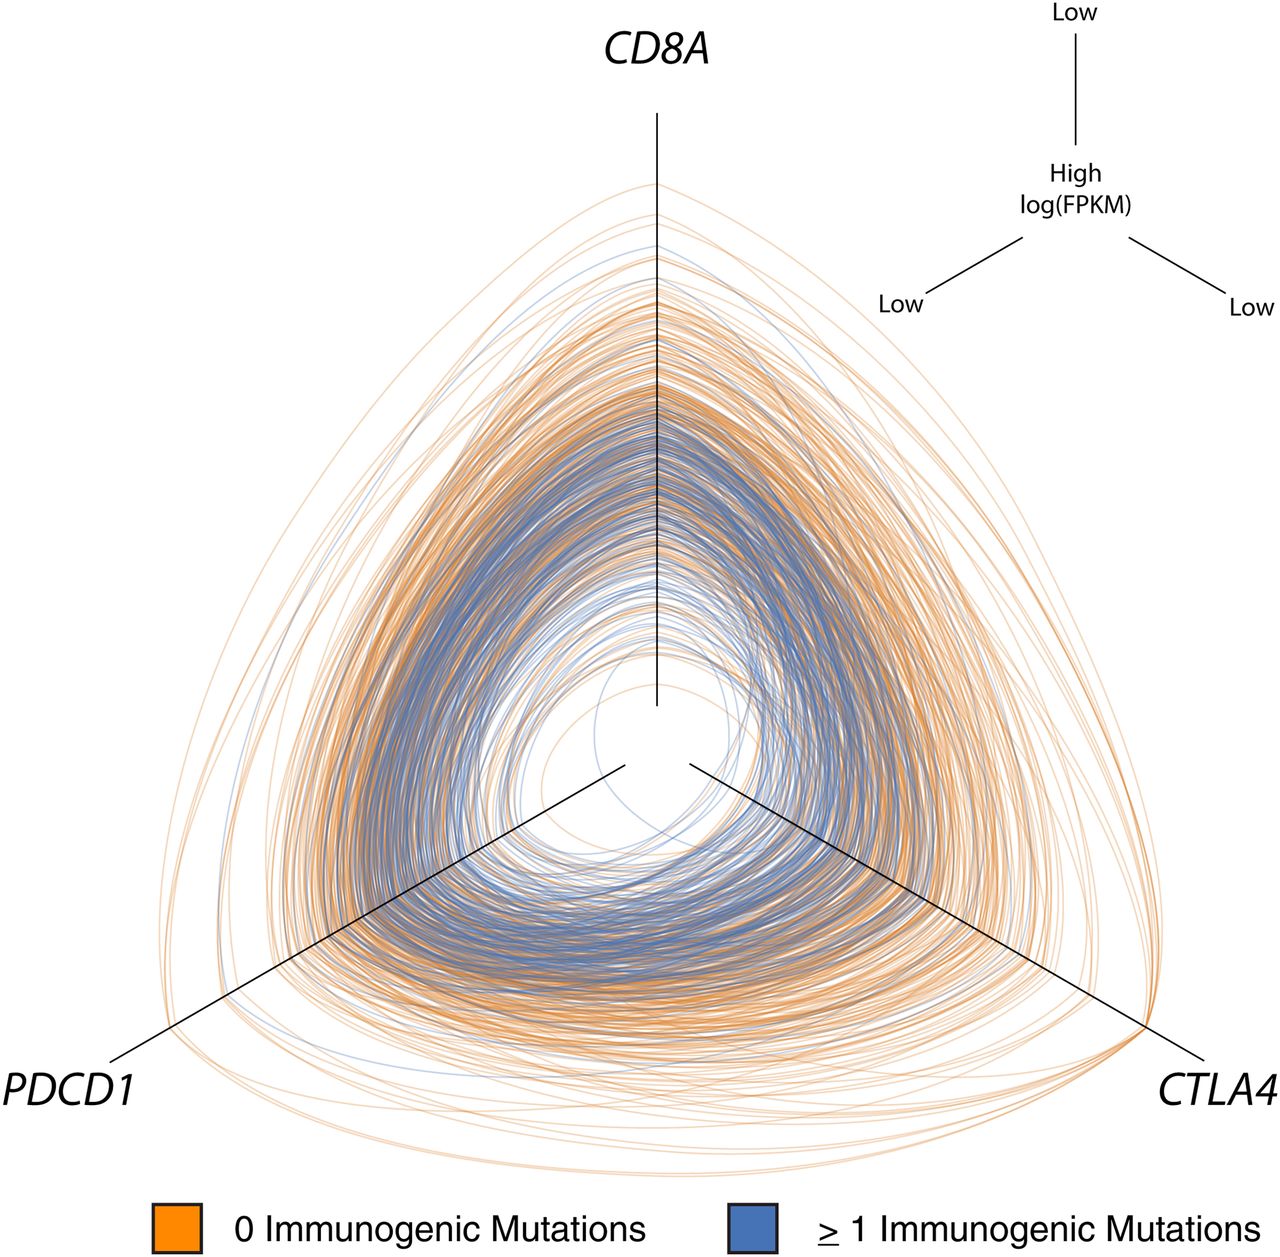
Hive plot showing that tumors with high immunogenic mutation counts have higher expression of CD8A, PDCD1, and CTLA4. On each axis is the log expression value (log[FPKM]) for CD8A (top), PDCD1 (left), and CTLA4 (right). Values go from small to large moving toward the center of the plot. Each ring represents one patient, and the intersection with the axis represents that patient’s value for that axis. Patients with zero predicted immunogenic mutations are colored orange, and patients with at least one predicted immunogenic mutation are colored blue. Blue rings tend to cluster around the center of the plot, indicating concordance between increased predicted immunogenic mutation count and elevated CD8A, PDCD1, and CTLA4 expression (P = 1.0 × 10⁻⁶).