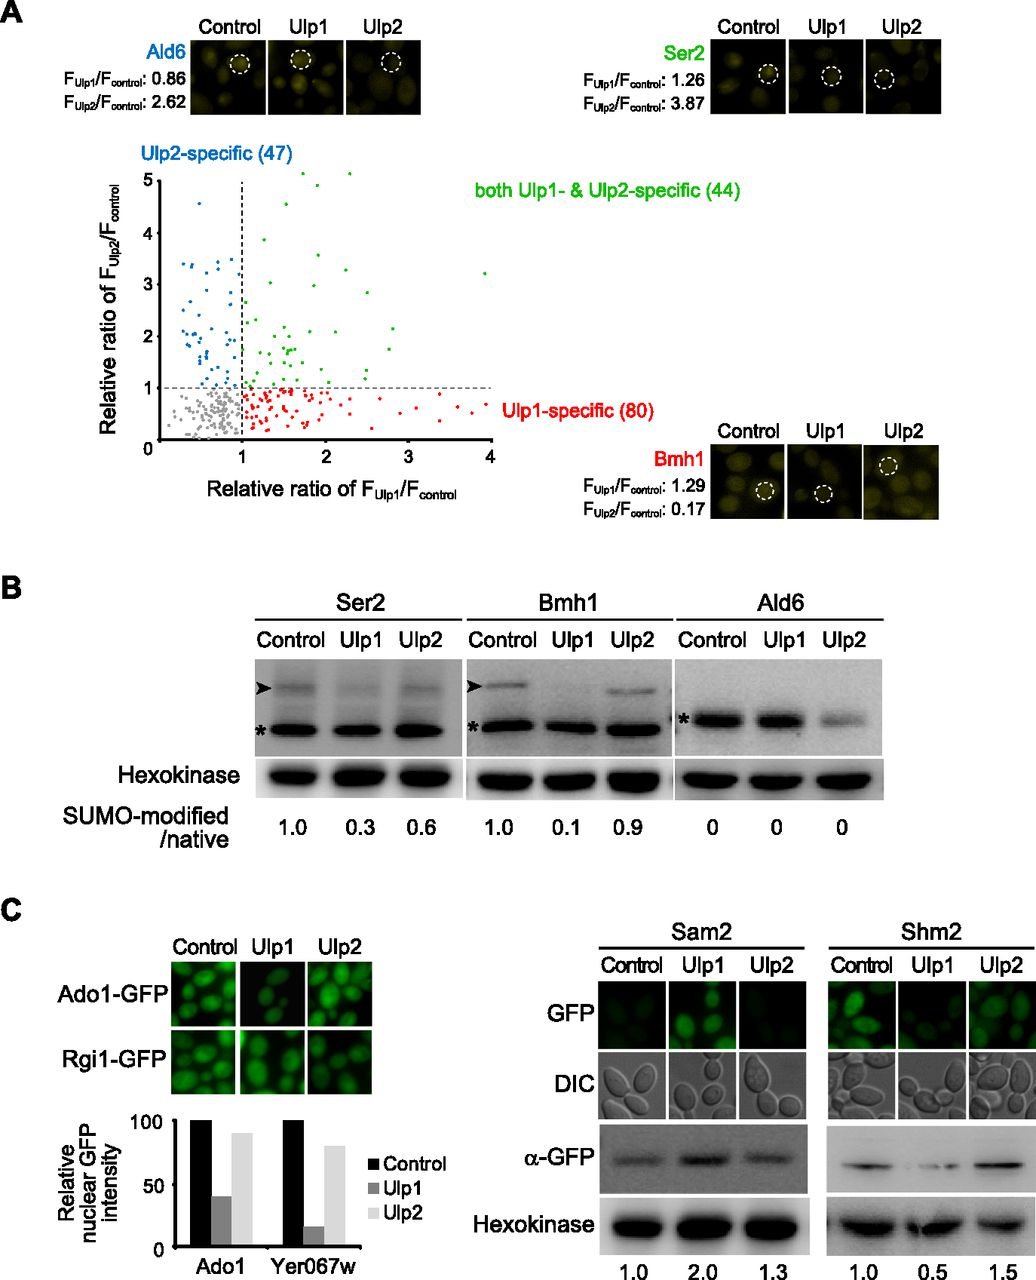
Substrate specificities of SUMO-specific proteases. (A) Classification of the substrate specificities of SUMO-specific proteases. A total of 280 class I proteins were analyzed by comparing the normalized BiFC intensity of cells overexpressing Ulp1 (FUlp1 = FUlp1_raffinose/FUlp1_galactose) or Ulp2 (FUlp2 = FUlp2_raffinose/FUlp2_galactose) with that of cells without overexpressing Ulps (Fcontrol = Fcontrol_raffinose/Fcontrol_galactose). The relative ratios of FUlp1/Fcontrol and FUlp2/Fcontrol for the 280 proteins are represented on the plot. Representative BiFC images of Ser2, Bmh1, and Ald6 for both Ulp1- and Ulp2-specific, Ulp1-specific, and Ulp2-specific substrates, respectively, are also shown. Control, Ulp1, and Ulp2 in the diagram indicate cells containing p415GAL, p415GAL-Ulp1, and p415GAL-Ulp2, respectively. For overexpression of Ulps, cells were grown in synthetic medium containing raffinose until mid-log phase and then transferred to and incubated in synthetic medium containing galactose for 2 h at 30°C. For the quantification of the BiFC signals, the mean fluorescence intensity of 20 cells for each strain was measured with custom software written in MATLAB (Mathworks). (B) Western blot analysis to validate Ulp1- and Ulp2-specific substrates. Immunoblots of Ser2, Bmh1, and Ald6 for both Ulp1- and Ulp2-specific, Ulp1-specific, and Ulp2-specific substrates, respectively, are shown. Yeast strains expressing the corresponding GFP fusion proteins with p415GAL, p415GAL-Ulp1, or p415GAL-Ulp2 were grown as described above. Total proteins were extracted, and immunoblotting was performed with a HRP-conjugated anti-GFP antibody. Hexokinase was detected with an anti-hexokinase antibody as an internal control. The relative ratio of SUMO-modified protein to native protein, normalized against that of the control without Ulps expression, is shown below each lane. Control, Ulp1, and Ulp2 in the diagram indicate extracts from cells containing p415GAL, p415GAL-Ulp1, and p415GAL-Ulp2, respectively. Arrowheads and asterisks indicate SUMO-modified and native protein bands, respectively. (C) Microscopic and Western blotting results showing the changes in the localization and the amount of proteins under overexpression of Ulps. (Left panel) Representative fluorescence images showing the changes in the localization of proteins under overexpression of Ulps. Yeast strains expressing the corresponding GFP fusion proteins with p415GAL, p415GAL-Ulp1, or p415GAL-Ulp2 were grown as described above. Control, Ulp1 and Ulp2 in the diagram indicate cells containing p415GAL, p415GAL-Ulp1, and p415GAL-Ulp2, respectively. For the quantification of the nuclear GFP signals, the mean fluorescence intensity of 20 cells for each strain was measured with custom software written in MATLAB (Mathworks). (Right panel) Representative Western blotting results showing the changes in the amount of proteins under overexpression of Ulps. Yeast strains expressing the corresponding GFP fusion proteins with p415GAL, p415GAL-Ulp1, or p415GAL-Ulp2 were grown as described above. Total proteins were extracted, and immunoblotting was performed with a HRP-conjugated anti-GFP antibody. Hexokinase was detected with an anti-hexokinase antibody as an internal control. The relative protein level is shown below each lane.