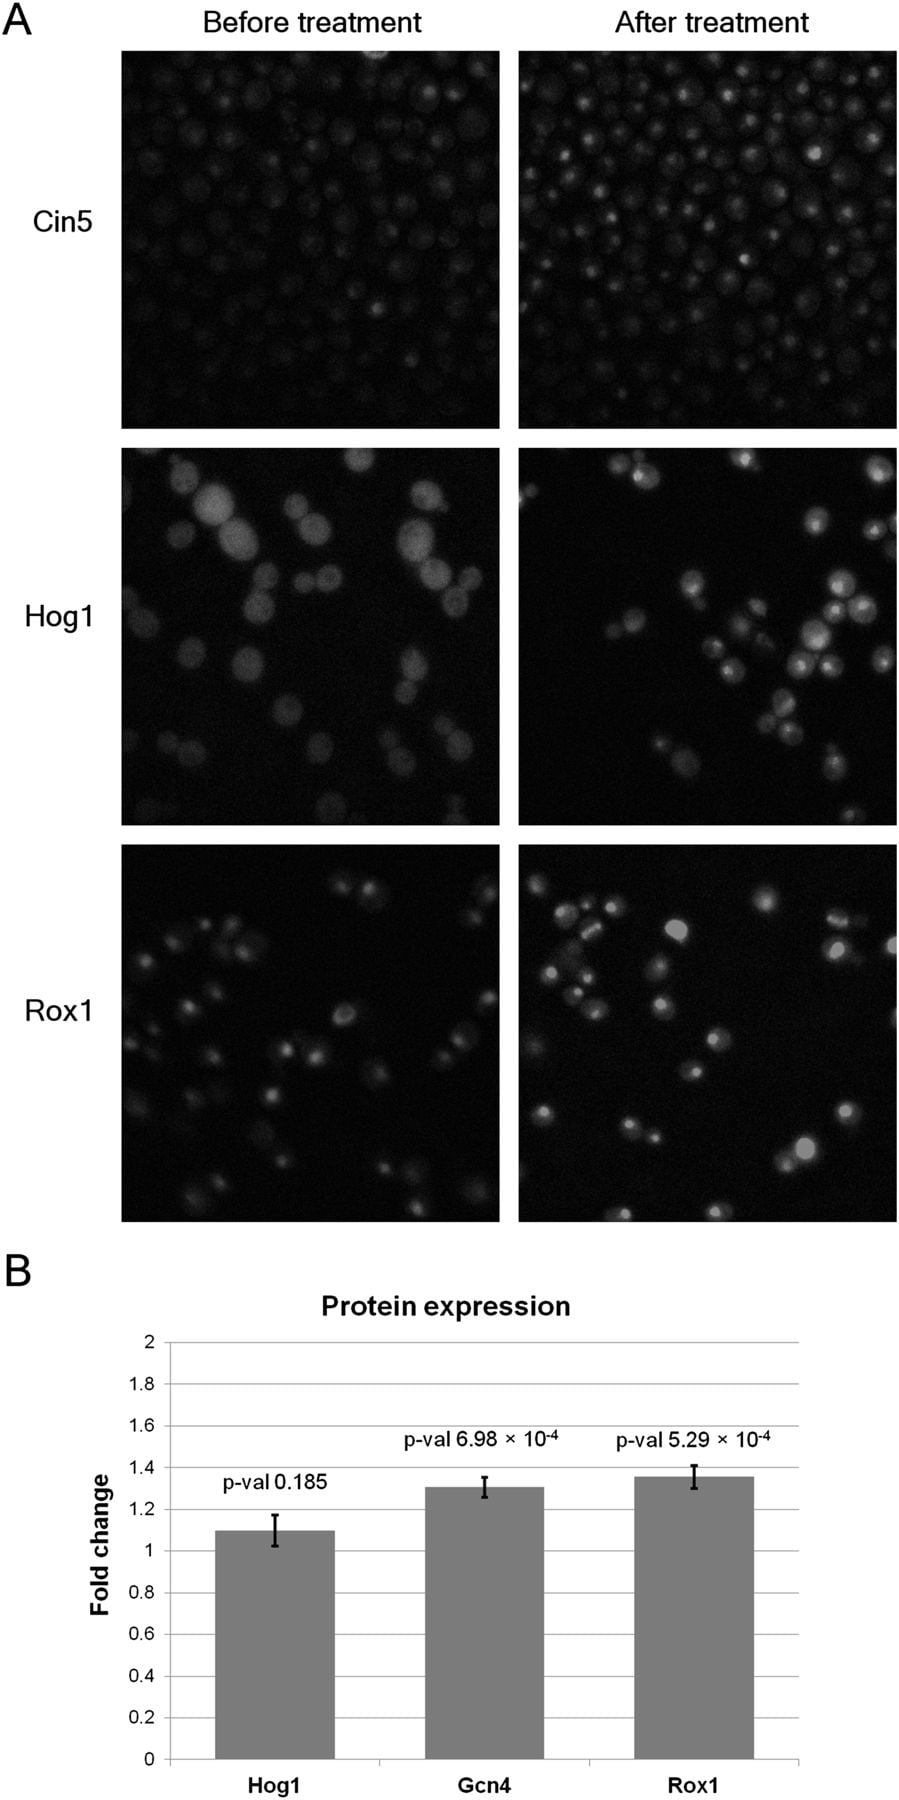
Figure 4.
Differential nuclear localization and protein expression after treatment with sorbitol. (A) Each row corresponds to localization of the predicted osmotic stress responder before and after sorbitol treatment. The images were taken 50 min after treatment for Cin5, 21 min for Hog1, and 26 min for Rox1. (B) FACS reveals increased protein levels for Gcn4 and Rox1. The y-axis is the protein level ratio relative to the level before sorbitol treatment. (Error bars) SD of the protein level ratios over all replicates.