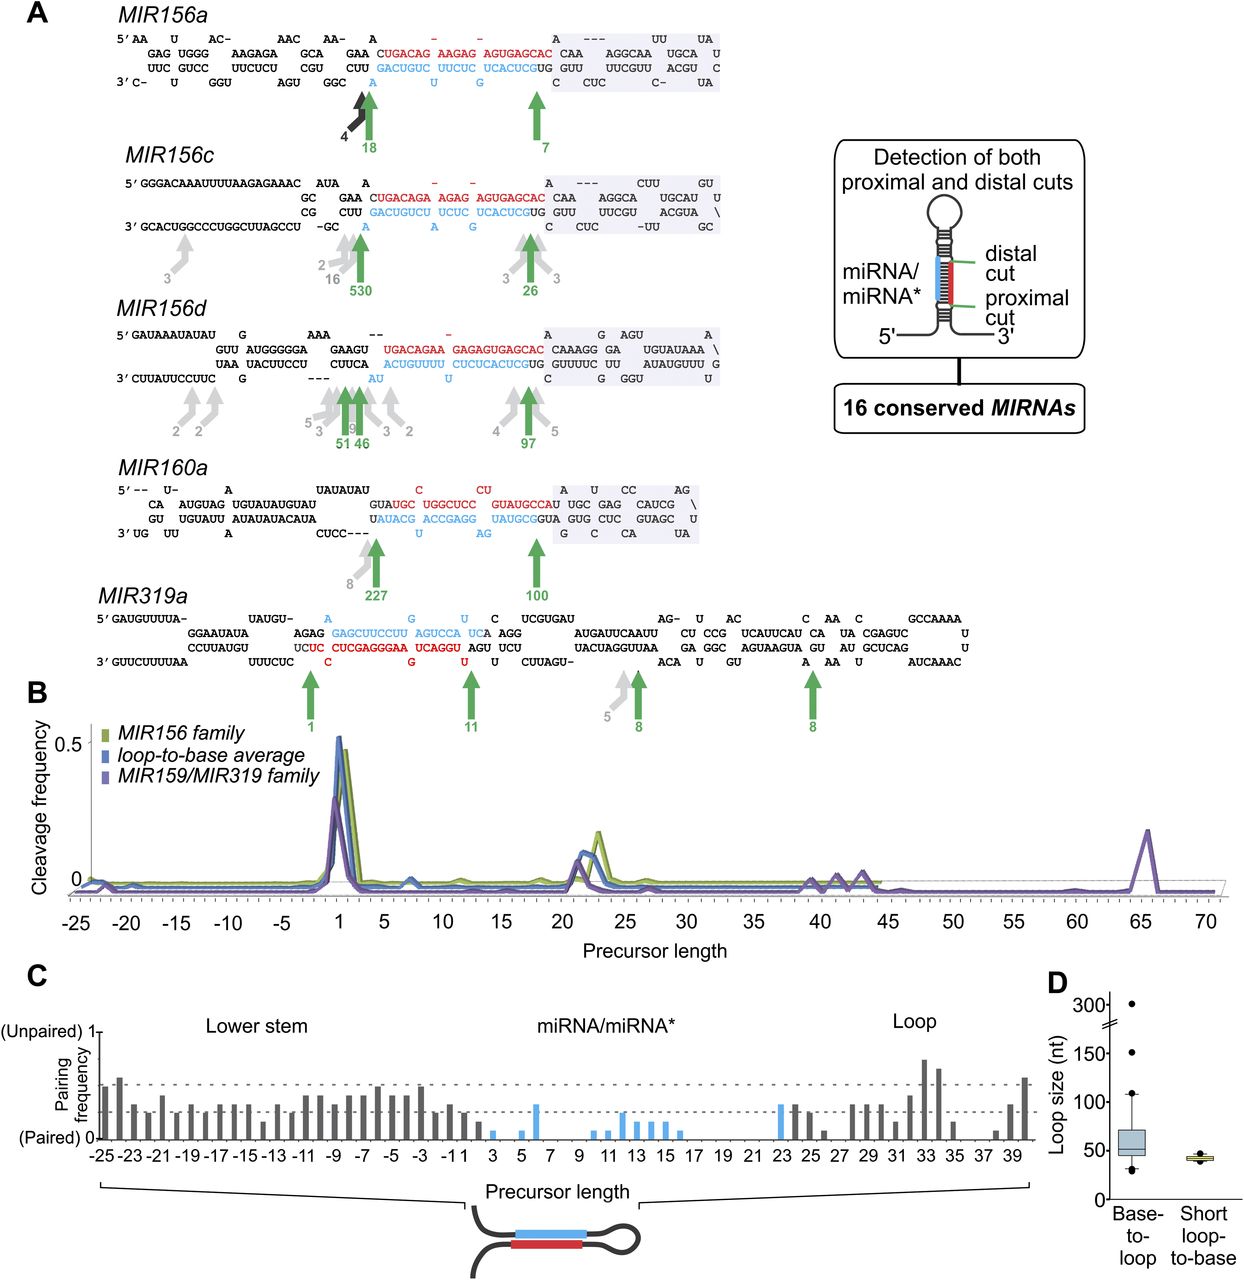
Loop-to-base processing of plant miRNAs. (A) Scheme showing the secondary structure of MIR156a/c/d, MIR160a, and MIR319a. The arrows indicate the positions and number of reads corresponding to the miRNA precursor cleavage sites identified. Green arrows show the most abundant cleavage site detected, which also match to the proximal and distal sides of the miRNA/miRNA* duplex of MIR156 and MIR160 and four DCL1 cuts of MIR319. Black arrows show other cleavage sites of at least 5% abundance of the total reads, while other minor cuts are shown in gray. A gray box highlights the structured upper stem of MIR156 and MIR160. The miRNAs are indicated in red and the miRNAs* in blue. (B) Distribution of cuts along the precursor sequences of the average of all conserved miRNAs detected as loop-to-base and individual miRNA families. The proximal side of the miRNA/miRNA* was defined as +1. Note that MIR159/319 precursors have two additional cuts. (C) Secondary structure of the precursors detected to be processed in a loop-to-base direction. The structures were obtained from mfold, and the matches in each position were considered as 0, while bulges and mismatches were considered as 1. (D) Size of the terminal region in base-to-loop (light blue) and short loop-to-base (yellow) precursors.