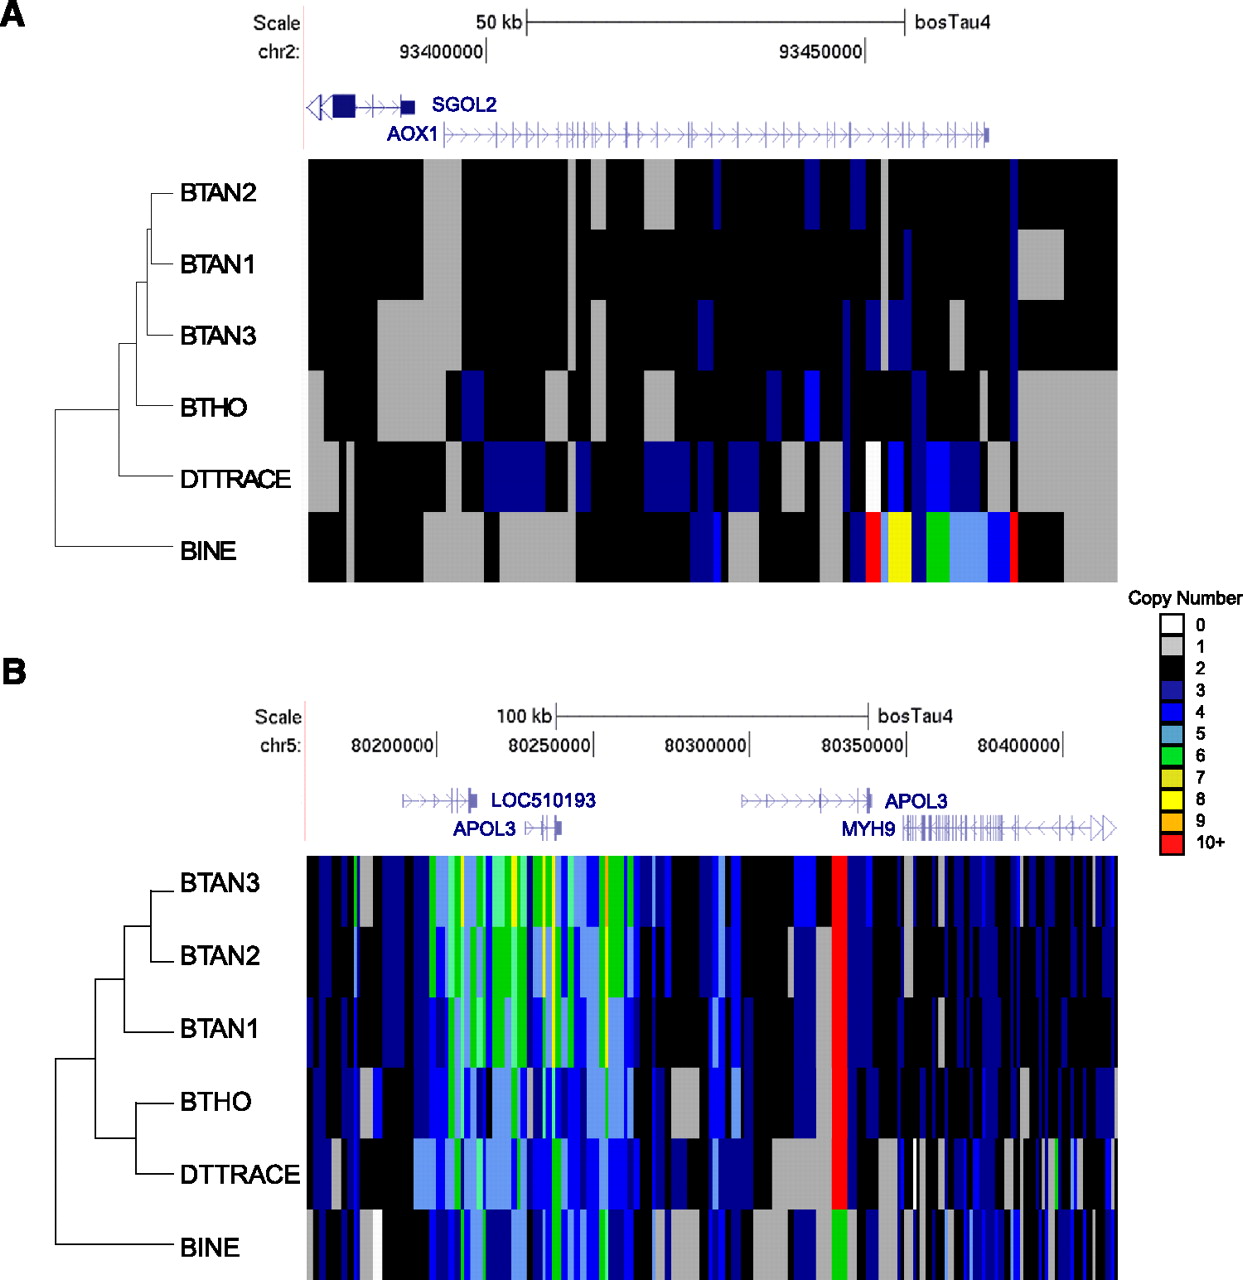
Cluster analysis of copy number variable genes in individual cattle. (A) Copy number values for each animal were plotted within the AOX1 locus (chr2:93376314-93484307) using the color scheme depicted in the legend. Heatmap boxes represent 1-kbp sliding, nonoverlapping windows in the region. The dendrogram indicates the hierarchical ordering of animals based on a Pearson's hierarchical clustering of the CN values within the region. Within AOX1, the last exons are predicted to have a higher CN in BINE than in any other animal. This observation was confirmed using aCGH and qPCR. (B) A heatmap of APOL3 reveals significantly higher CN in the three Angus animals (BTAN3, BTAN2, and BTAN1) for the first APOL3 transcript (NM_001100297) than in the other breeds (chr5:80158821-80417344).