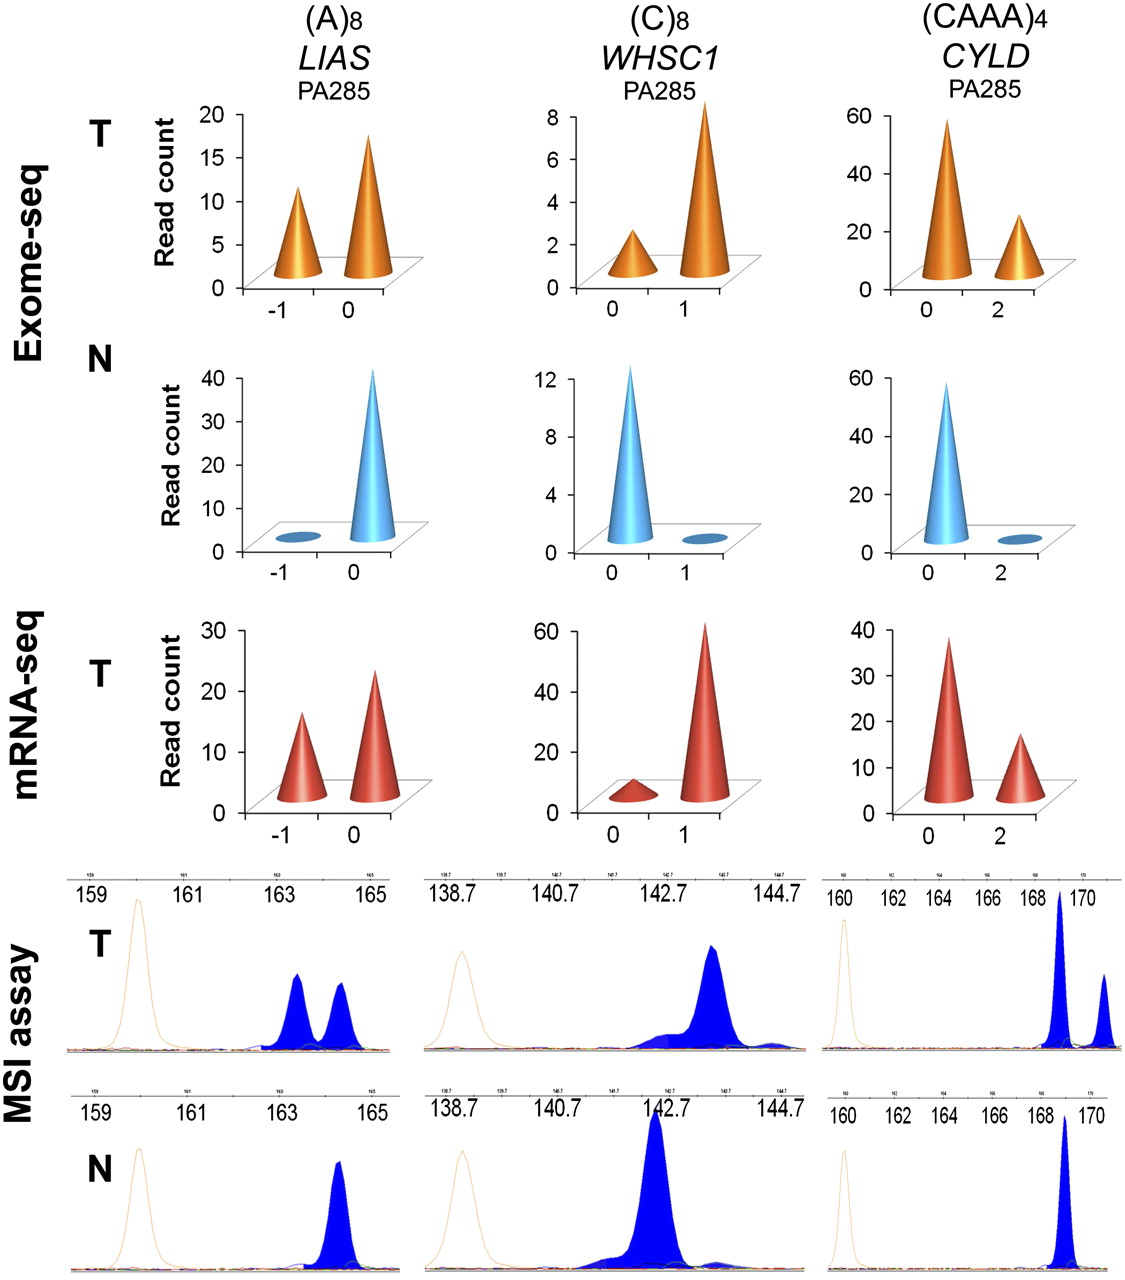
Figure 4.
MSI analysis using Exome-seq. The data for three representative microsatellites are shown. (Top) Read-depth based Exome-seq data; (middle) mRNA-seq data; (bottom) electropherograms of the conventional MSI assay. For the top and middle panels, the x-axis indicates the lengths of indels. The negative value indicates base deletion, and the positive value indicates base insertion, while 0 indicates no indel. The numbers marked at the y-axis indicate the number of sequence reads that carry the mutant allele or the wild-type allele. (Bottom) x-axis is the size in bases; y-axis is the fluorescence intensity. The red peaks are internal size standards.