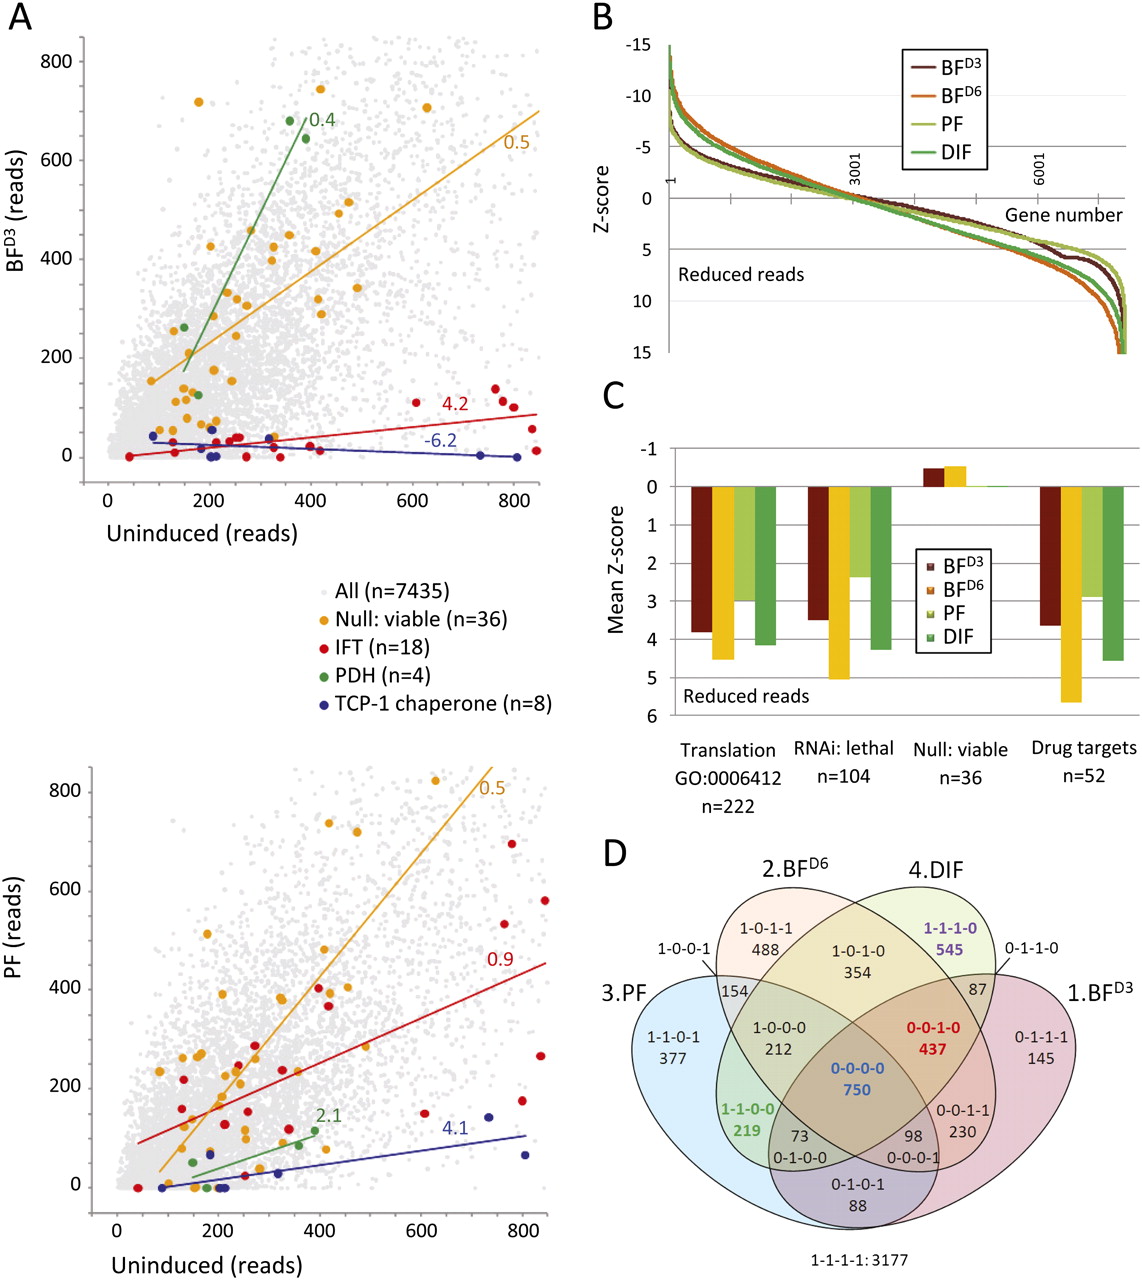
RIT-seq digital data analysis and validation. (A) The scatter-plots illustrate groups of genes that display different loss-of-fitness profiles in the BFD3 (upper plot) and PF experiments (lower plot). Trend lines and slope scores are shown. (IFT) Intraflagellar transport (all genes identified to date); (PDH) pyruvate dehydrogenase (four-subunit complex); (TCP-1) T-complex protein 1 (eight-subunit chaperone ring complex); (n) number of genes (see Supplemental File 1B for details). (B) The distribution of Z-scores for 7435 genes and for each of the four experiments based on DEG-seq analysis; a Z-score of >3.3 represents a significant loss-of-fitness. (C) The plot shows mean Z-scores, based on DEG-seq analysis, for genes with the GO-term annotation “translation” and groups of characterized genes for each of the four experiments. Genes were selected based on a combination of TriTrypDB and PubMed searches (See Supplemental File 1B for details). (D) The four-set Venn diagram shows the distribution of genes based on DEG-seq analysis. The binary codes score the output from each of the four experiments (1–4) in the order indicated, with “0” representing a significant loss-of-fitness. For example “0-0-1-0” genes are associated with a loss-of-fitness in all three experiments involving RNAi induction during growth as bloodstream-form cells. The DIF experiment involved RNAi induction throughout growth as bloodstream forms, differentiation and growth as procyclic forms, so any gene required for growth in either life-cycle stage or for differentiation should register a loss-of-fitness in this experiment. The four cohorts illustrated in Figure 2A and Figure 3 are highlighted (bold colored text).