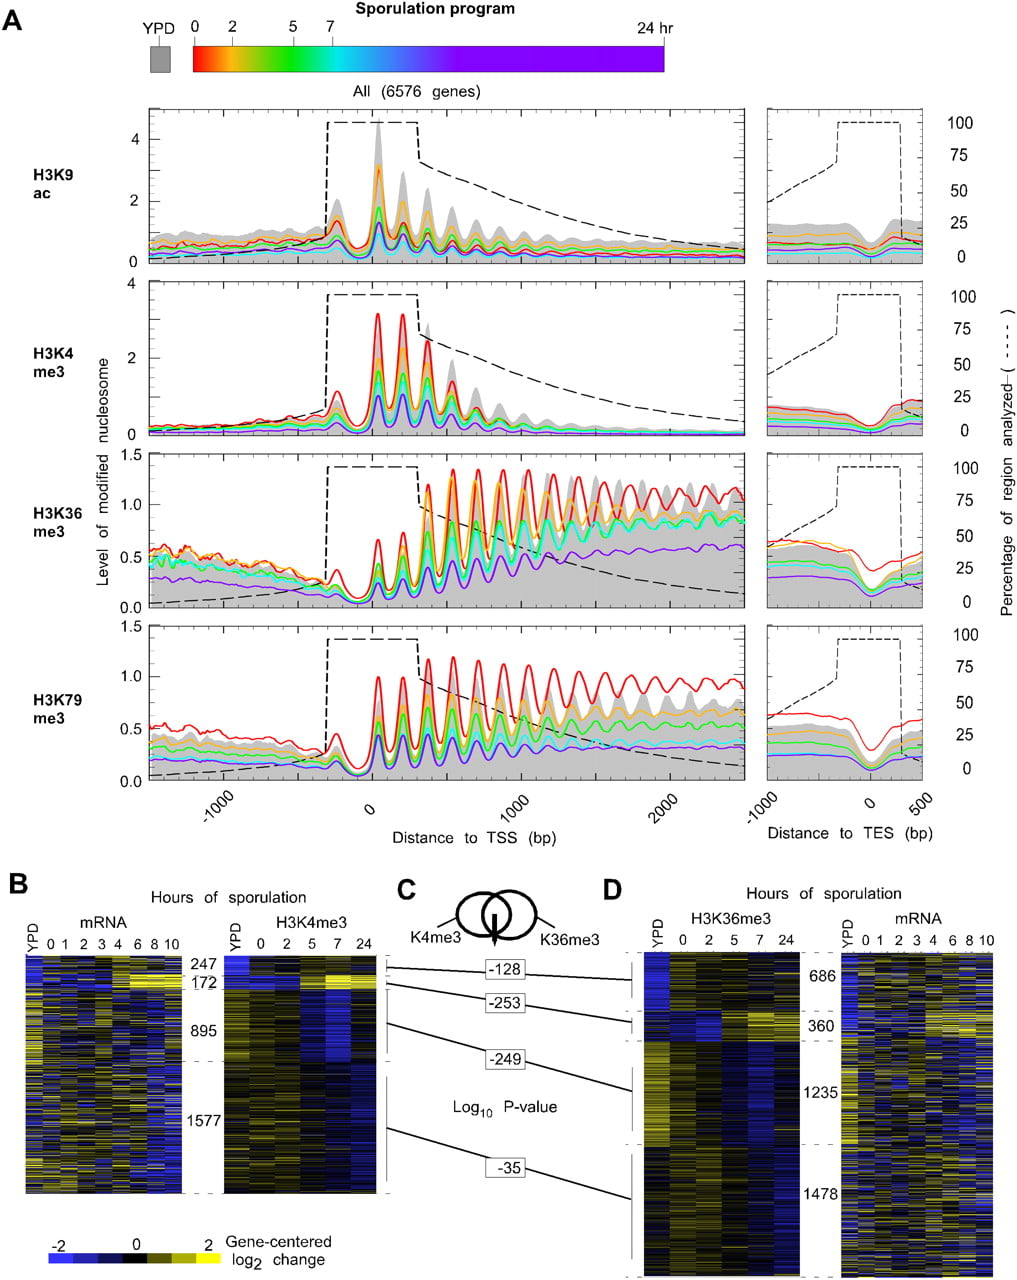
Nucleosomal and histone modification distribution around genomic features. (A) Distributions of indicated H3 modification states (rows of panels) are plotted around the TSS and TES for all genes. Traces reflecting different time points in the sporulation program are color-coded as indicated, and further described in Figure 1A. Total tag counts in each sample were scaled to reflect the bulk distribution, measured by immunoblotting (Supplemental Fig. S8). Consequently, the plots reflect the level of modified nucleosomes, not the density of modification per H3 nucleosome. The H3K79me3 antibody may have significant cross-reactivity with me2. Cluster plots for H3K4me3 (B) and H3K36me3 (D) changes on a gene-by-gene basis show that both H3K4me3 and H3K36me3 are linked with transcription. In contrast to A, the total tag count for all samples (H3, H3K4me3, and H3K36me3) were normalized to be equal. Each row included gene-centered log2 transformed H3K4me3/H3 ratios (from the 0- to 500-bp region relative to TSS for H3K4me3 and the 300- to 1000-bp region relative to TSS for H3K36me3) for all six time points. Gene-centering means that the average of each row is set to zero. All genes were arranged by k-means clustering (k = 5). The number of genes in each cluster is indicated. One cluster was omitted as it displayed no changes. Corresponding changes in mRNA levels (Primig et al. 2000; Williams et al. 2002) are shown. Levels of mRNA were gene centered and log2 transformed. (C) χ-tests between clusters of H3K4me3 and H3K36me3 suggest that two methylation marks are significantly coincident. Venn diagram relating the overlap of clusters 1–4 in B with the corresponding clusters in D. Values below the Venn diagram reflect log10 P-values (χ-test) of the overlapping membership.