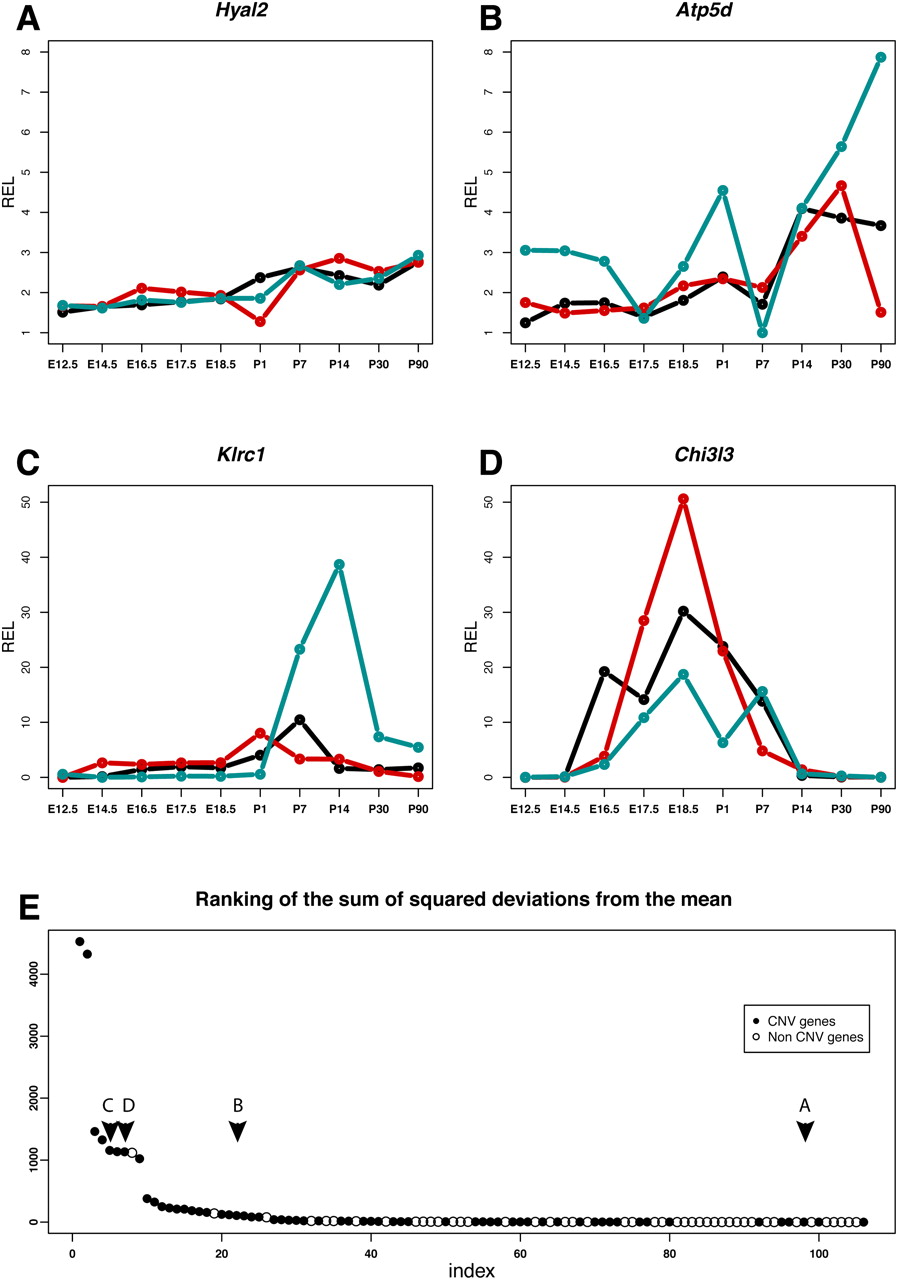
Ten-stage expression profiles of liver CNV transcripts. Real-time quantitative PCR-measured relative expression levels of CNV transcripts during development (E12.5, E14.5, E 16.5, E17.5, E18.5, P1, P7, P14, P30, P90 time points) in the three inbred strains: C57BL/6J (black line), DBA/2J (red), and 129S2 (teal). Examples of liver CNV transcripts showing a similar (A) or a divergent expression profile between strains are shown (B–D). (REL) Relative expression level. (E) Assessed transcripts were ranked decreasingly by the sum of squared deviations from the mean between strains for each developmental time point. (Filled circles) CNV transcripts; (open circles) non-CNV transcripts. Data from liver are shown, while data from brain are presented in Supplemental Figure S4. We observe in both brain and liver a statistically significant enrichment of CNV transcripts among the transcripts with the highest score, i.e., the transcripts that vary more between strains (see text for details; Wilcoxon signed-rank test P = 6 × 10⁻⁶ [liver] and P = 10−3 [brain]). The position within the ranking of the CNV-transcript profiles presented as examples in A–D are indicated.