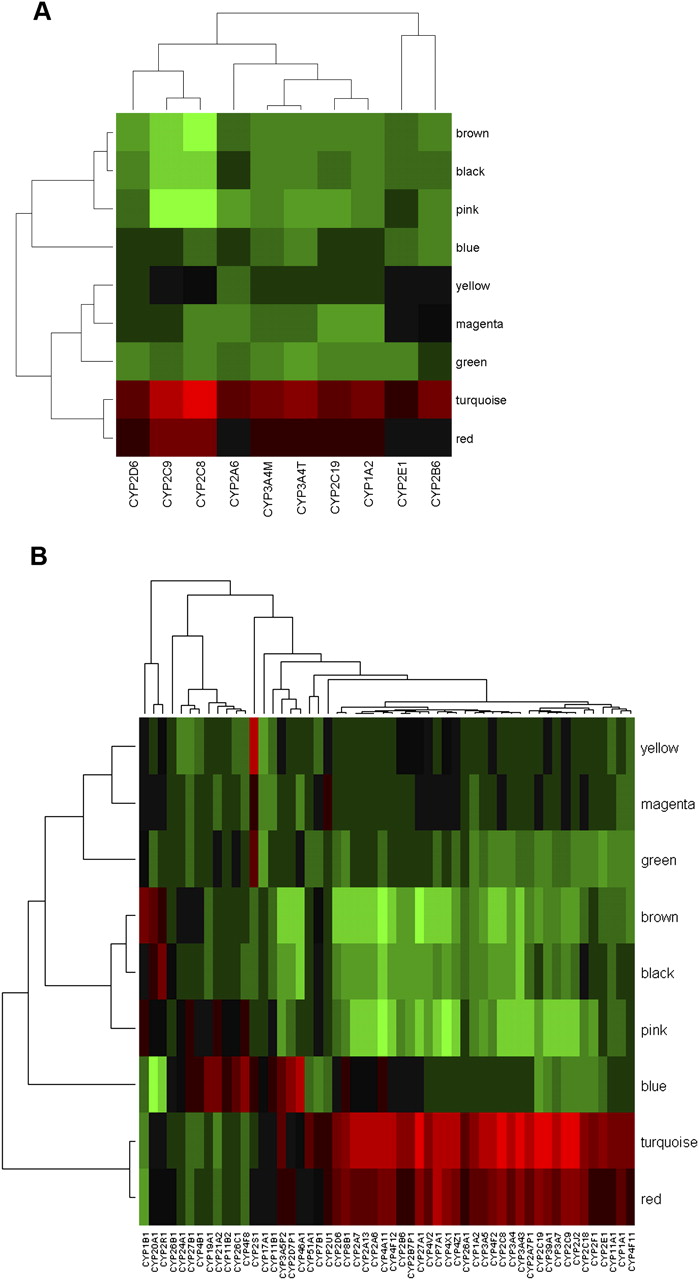
Module relevance to various P450 traits of interest. To examine how each gene module is related to P450 enzyme activity/gene expression level, we performed principal component analysis (PCA) for each module and then took as module relevance the value of the correlation between the first principal component (module eigengene) and the enzyme measure. (A) Clustering analysis on the module relevance to P450 enzyme activities; (B) Clustering analysis on the module relevance to P450 gene expression. Red color indicates positive correlation, and green represents negative correlation. The turquoise module is most significantly (P-value < 0.001) positively correlated with the expression of many of the P450 genes and all P450 enzyme activity measurements except for CYP2E1. Three other modules—namely, the red, pink, and brown modules—are also significantly correlated with both the enzyme activity and gene expression levels of many P450s (P-value < 0.05), although the specificity for P450s vary among these modules.