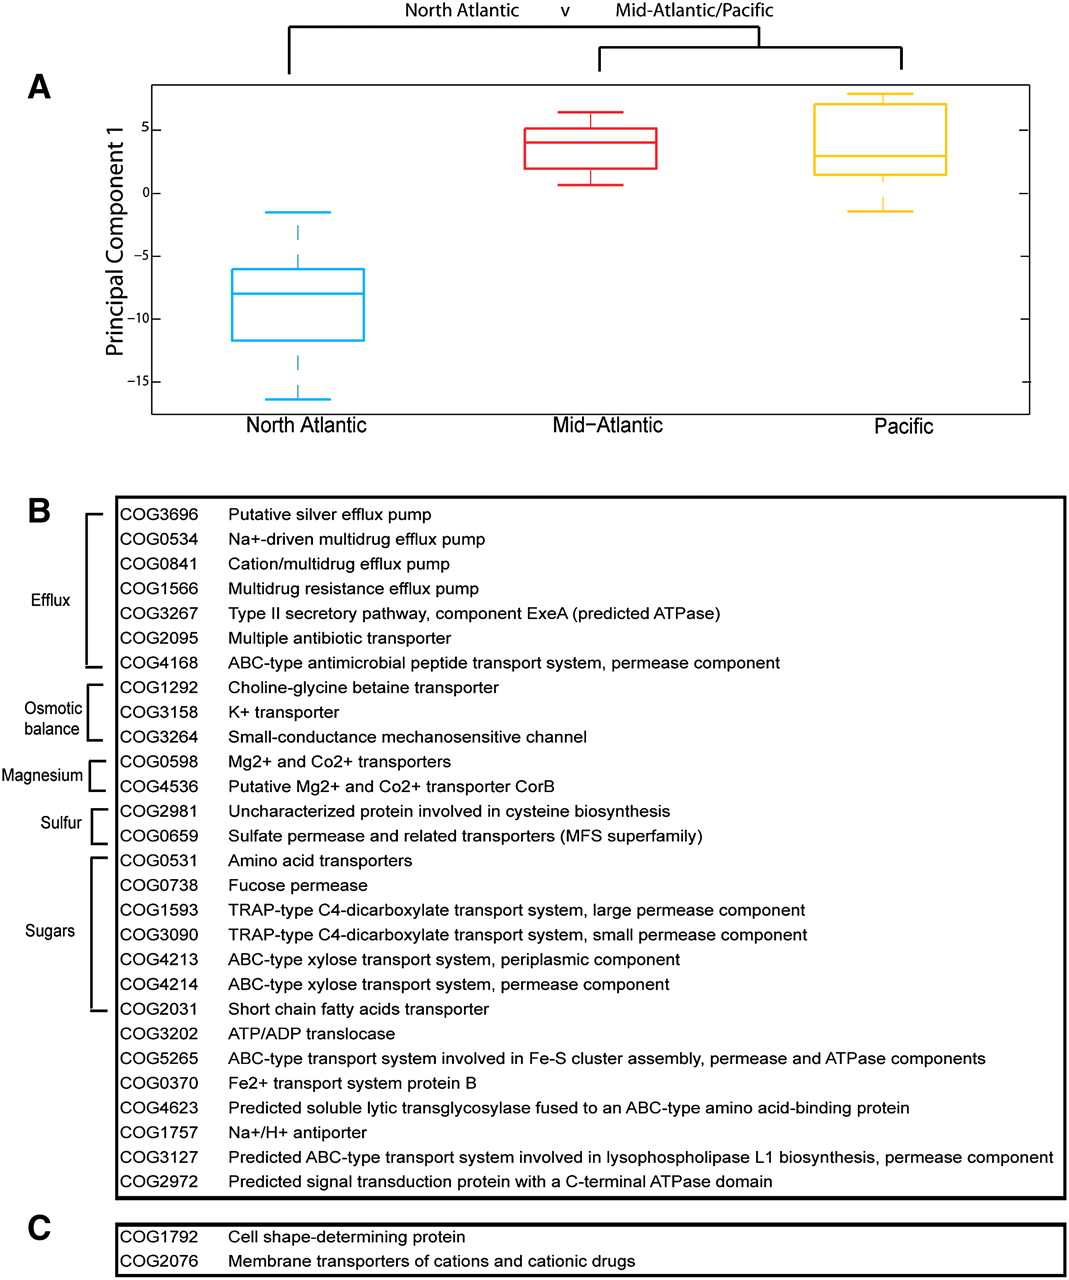
Figure 4.
(A) Boxplot of PCA first component scores on the membrane protein family matrix. Separating sites by environmental clusters from Figure 2A shows that the North Atlantic scores are distinguishable from the Mid-Atlantic/Pacific. (B,C) Discriminate partition matching. Membrane protein families discriminating between site groups. Membrane protein families enriched in the North Atlantic (B) and Mid-Atlantic/Pacific (C).