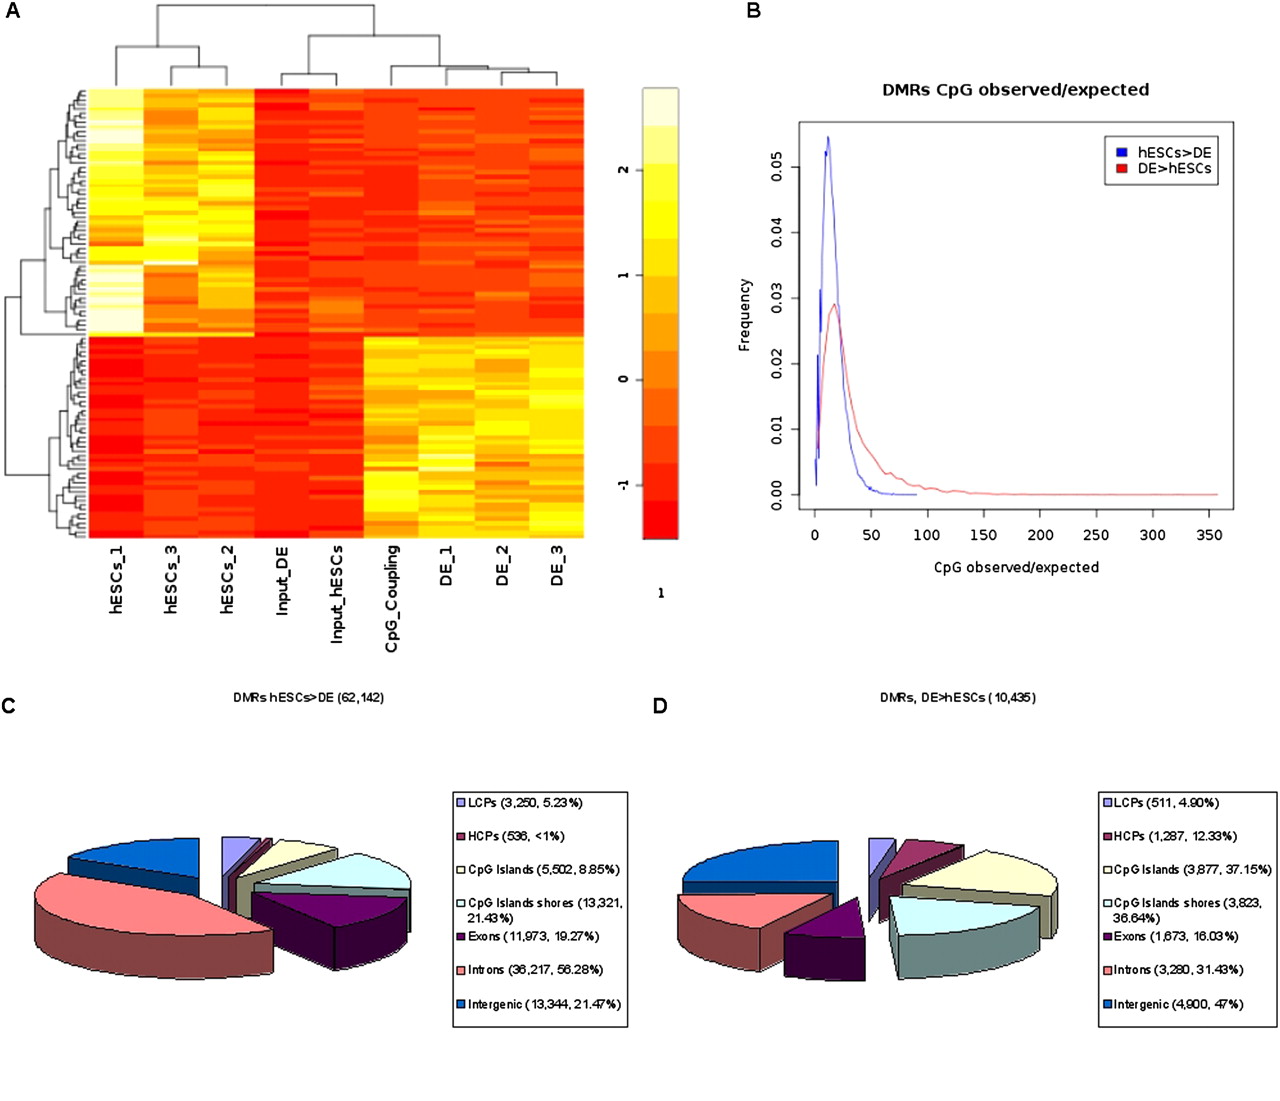
Differentially methylated regions (DMRs). (A) Heatmap of 100 DMRs, selected by highest variances between samples, including mean rpm signals for the three biological replicates of hESCs, and DE cells, the input sample from hESCs, the input sample from DE, and scaled mean CpG coupling factors. Differential methylation was calculated based on the pooled sets for hESCs, DE, and input (see Methods and Supplementary Methods). (B) Distributions of CpG observed/expected (Gardiner-Garden and Frommer 1987) ratios for demethylated regions (hESCs > DE) and de novo methylated regions (DE > hESCs). The identified demethylated (C) and de novo (D) methylated regions were annotated for Ensembl (Birney et al. 2004) transcript promoters (−2 kb to +0.5 kb regions around their TSSs; divided into LCPs and HCPs), CpG islands (Takai and Jones 2002) and their shores (−0.5 kb from the start or +0.5 kb from the end of a CpG island), exons, introns, and intergenic regions (no overlap with promoters and transcript bodies). Regions can be associated to more than one annotation (e.g., exon and CpG island).