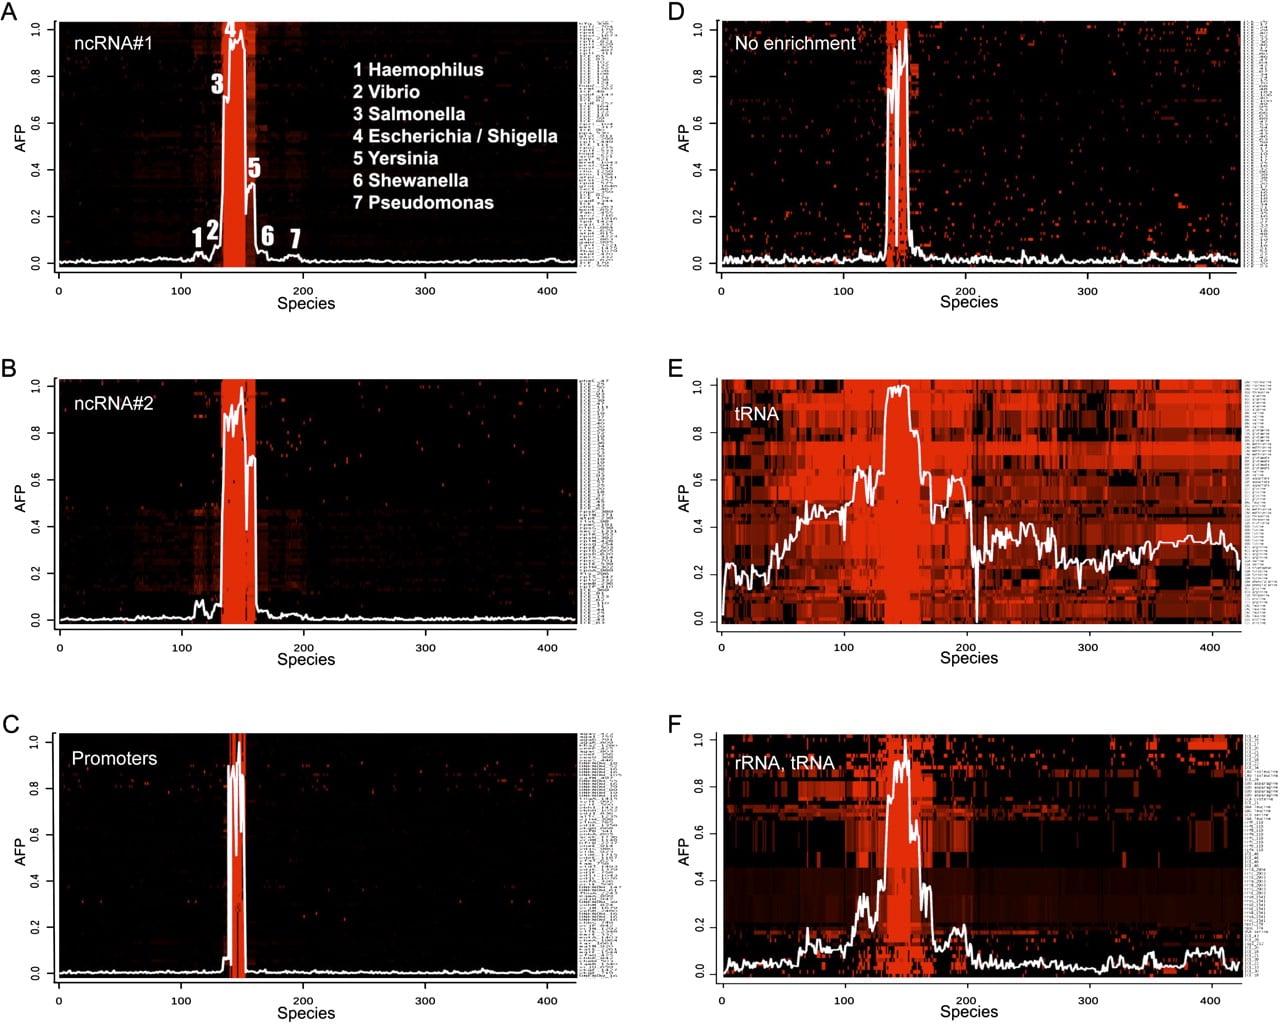
Heat-map representations of NAPP clusters in E. coli K12. Each panel shows a representative part of a K-means cluster from Figure 2A. Each K-means cluster was reclassified by hierarchical clustering and displayed as a heat-map using Eisen software (Eisen et al. 1998). The horizontal axis represents the 423 bacterial species ordered according to a 16S rRNA tree. The right vertical axis represents CNEs or CDSs. A red dot indicates the presence of a given CNE/CDS in this species with color intensity proportional to normalized BLAST scores. The histogram superimposed on each cluster represents the average phylogenetic profile for this cluster (AFP, left vertical axis) obtained by averaging dot intensities in columns. (A) ncRNA-rich cluster #1 from Figure 2A; (B) ncRNA-rich cluster #2 from Figure 2A; (C) a promoter-rich cluster; (D) a cluster with no apparent functional enrichment; (E) the main tRNA cluster; and (F) a cluster containing mostly tRNAs and ribosomal RNAs.