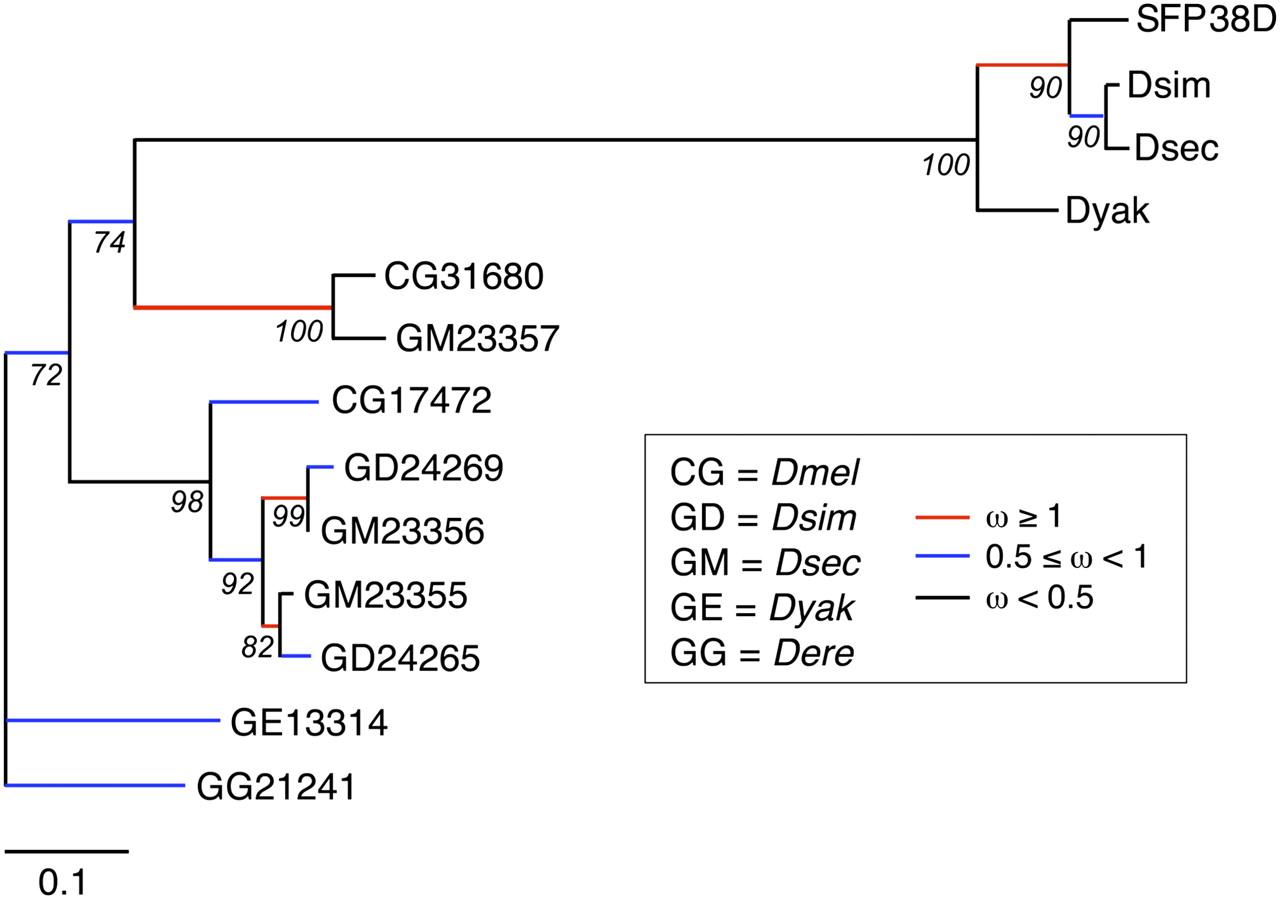
Phylogenetic analysis of SFP38D and its tandem duplicates. Phylogenetic tree of coding DNA sequences for SFP38D, its orthologs, and its paralogs from D. melanogaster (CG17472 and CG31680) and additional species. Branch color indicates the estimated ω rate for each branch. Red color indicates branches that are predicted to have experienced positive selection. Values of ω for red branches are, from top to bottom: 1.33, ∞, 2.02, ∞. Numbers under each node indicate percentage of bootstrap support for the phylogeny based on 1000 replicates. Sequences for SFP38D and its orthologs were obtained from BLAST and BLAT searches; other sequences represent gene models (numbered as indicated for each species) available from FlyBase. Note that though branches are colored so as to indicate which range of ω values they fell into, the model estimated a precise value for each branch.