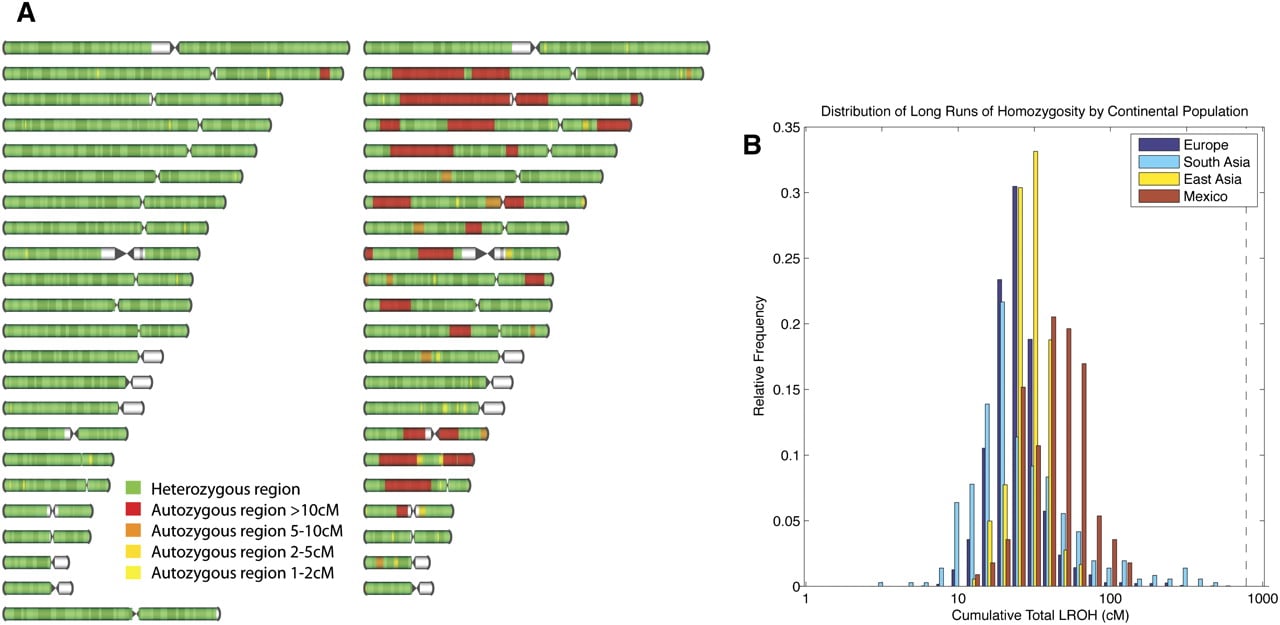
Figure 4.
Patterns of homozygosity in the human genome. (A) Genome ideograms (ordered by chromosome number with chromosome 1 at the top) showing LROHs in two European individuals. The female individual shown on the left shows typical levels of homozygosity, whereas the male individual shown on the right shows the most LROHs in the study. (B) Distribution of the cumulative total LROH per individual by continental population (shown on a log scale). The location of the most extreme individual (shown in A) is indicated by a vertical dashed black line. Note that the total genetic length of the human genome is ∼3614 cM (Kong et al. 2002).