Figure 4.
A plot showing different methods in terms of coverage in human genes (x-axis) vs. number of genes in syntenic relationships (y-axis).
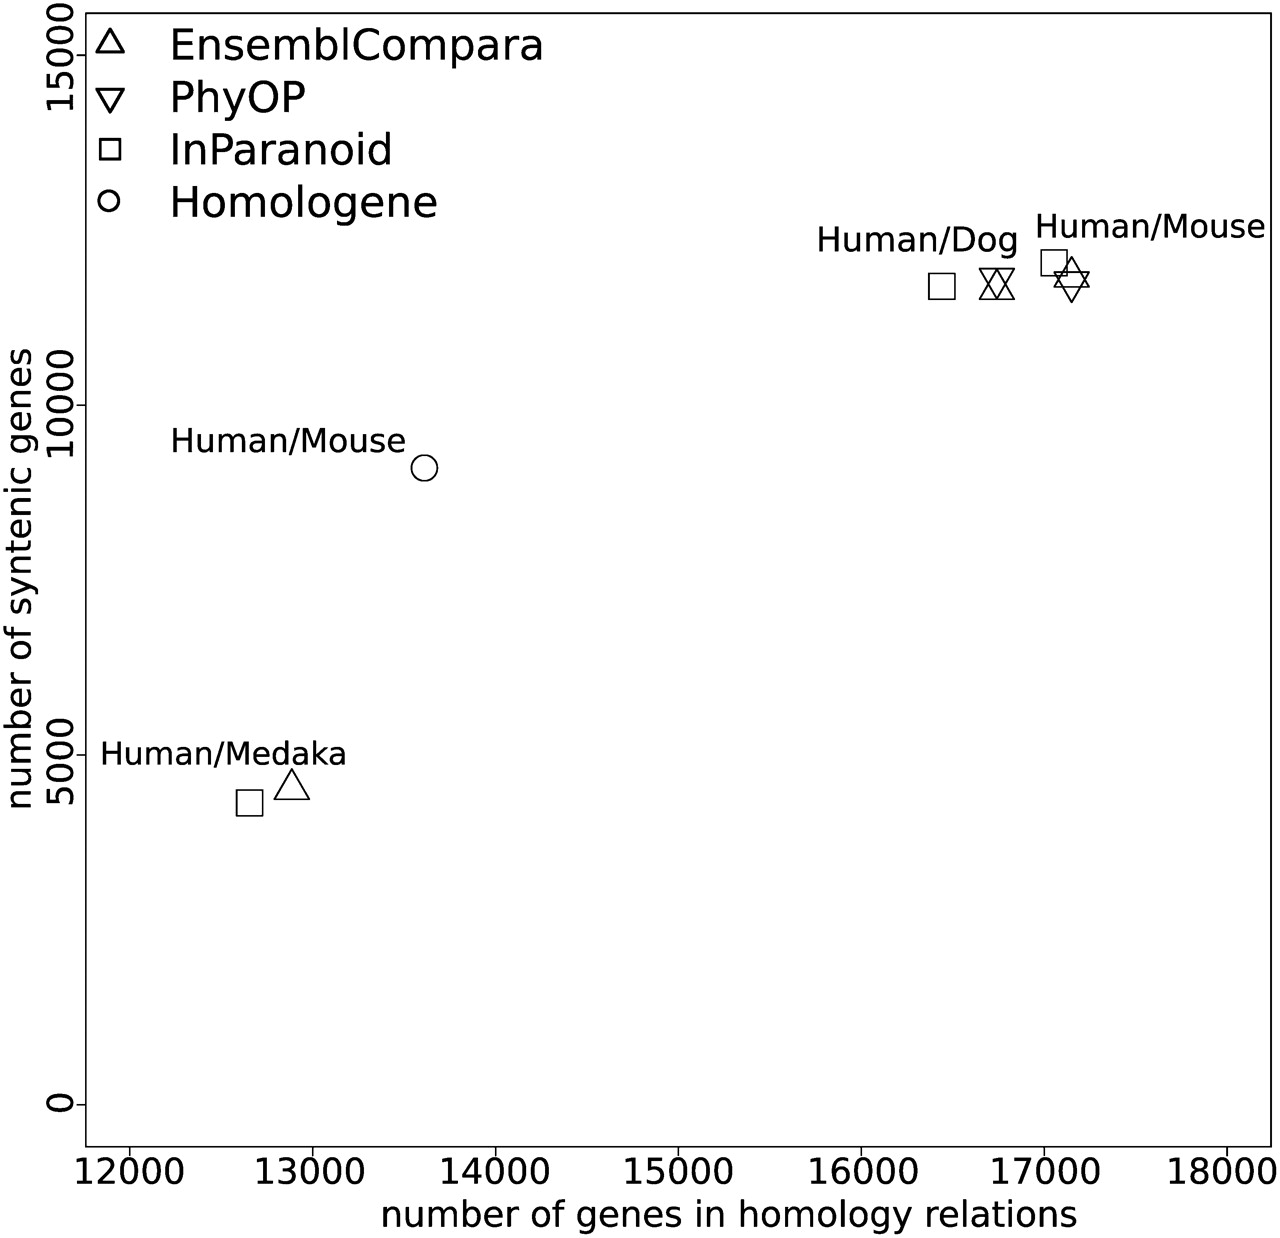
A plot showing different methods in terms of coverage in human genes (x-axis) vs. number of genes in syntenic relationships (y-axis).