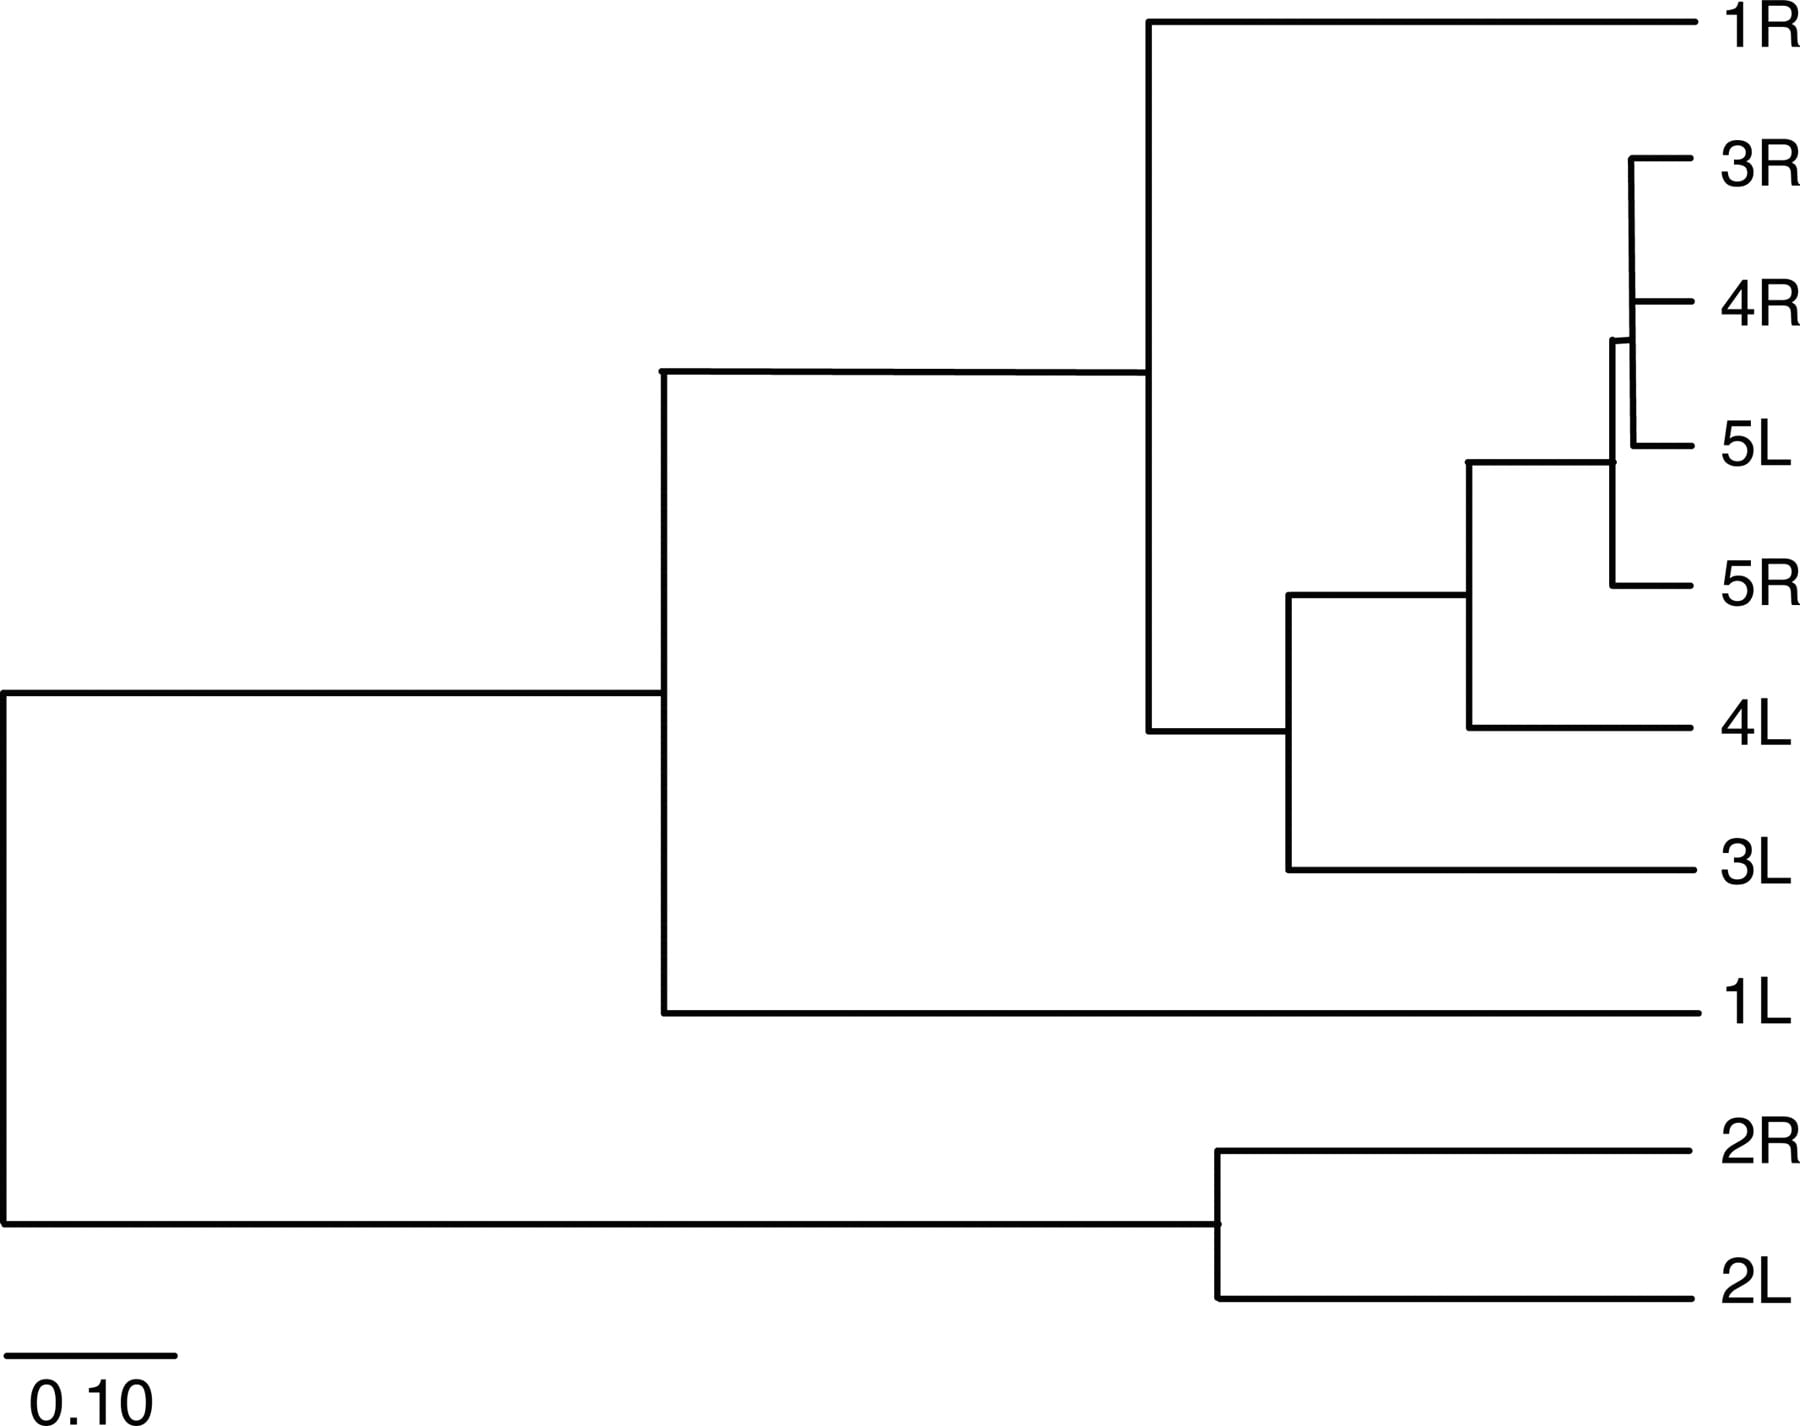
Figure 4.
Interpersonal and intrapersonal variation. A UPGMA dendogram of pairwise θ values comparing community structure of OTUs from each arm of each subject. The length of the scale bar represents a distance of 0.10 (1 − θ). Values for θ were calculated for OTUs with ≥97% similarity (Supplemental Table 3). (L) Left arm; (R) right arm.