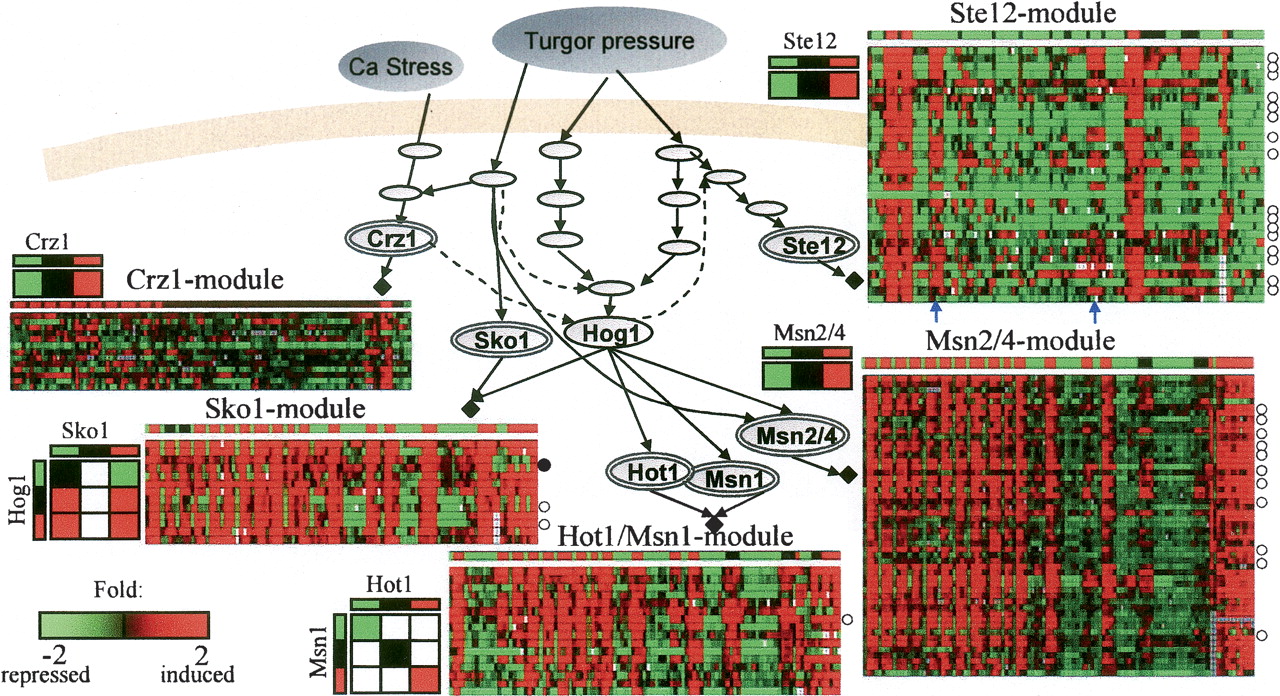
Expansion of the osmotic network model. The expansion algorithm assigns known and novel target genes to known modules (black diamonds). Each module is represented by a matrix showing the expression of its target genes (rows) across the 106 conditions (columns). Known target genes that were assigned to their module correctly/incorrectly are marked with white/black circles to the right of the corresponding row (known targets were excluded from the model before expansion, to allow validation and to avoid circularity). The predicted expression levels in each condition appear as a separate row above the matrix. The logic of each module, obtained by the refinement procedure, appears near the matrix. We show in color only logic entries with significant improvement score. In general, there is high agreement between model predictions and observed levels. The few cases of disagreement (e.g., columns marked by blue arrows in the Ste12 module) highlight our incomplete understanding (and hence modeling) of the biological system. The full details on each module appear in Supplement C, including lists of correct/incorrect target genes, and their sources in the literature.