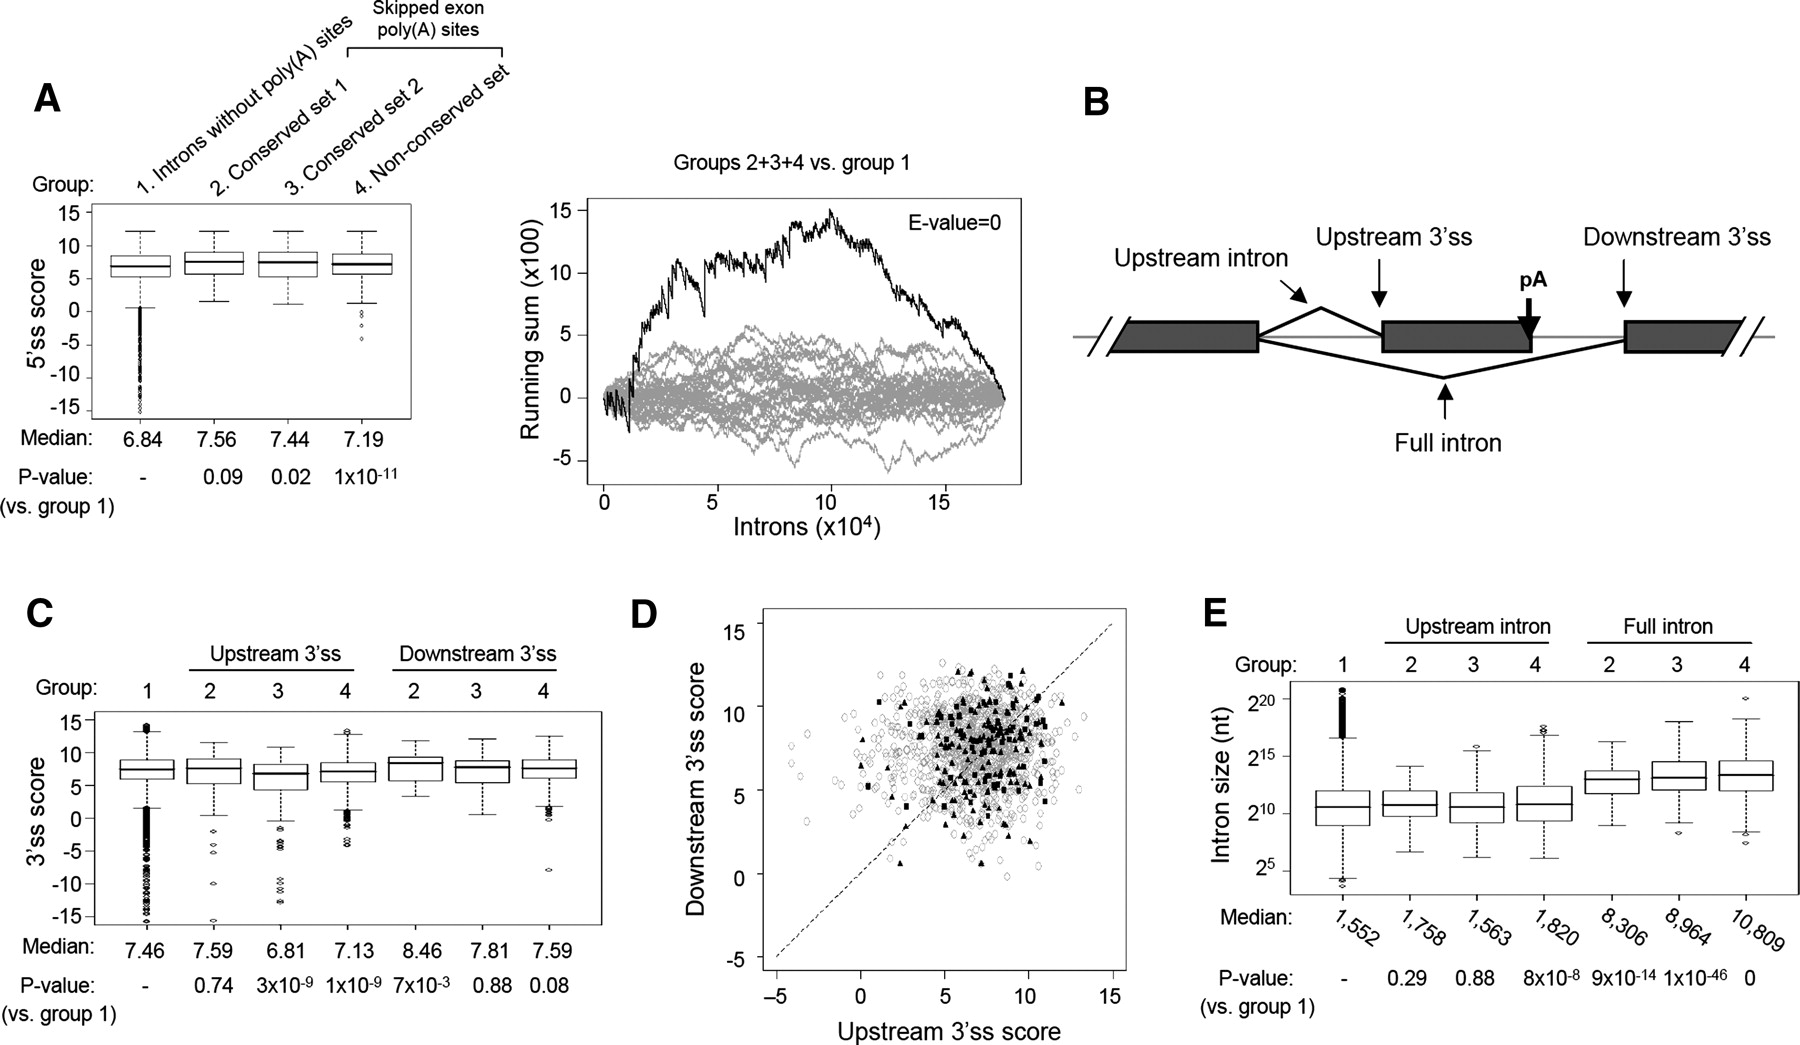
Characteristics of introns containing skipped exon poly(A) sites. (A) Boxplots of 5′ss scores for 4 groups of introns (left) and a mKS test result (right) comparing introns without poly(A) sites with introns with skipped exon poly(A) sites with respect to 5′ss scores. The E-value represents the probability of getting higher values in groups 2 + 3 + 4 than in group 1 by random chance. (B) Schematic of a skipped terminal exon in an intron. (C) Boxplots of 3′ss scores for four groups of introns. Both upstream 3′ss and downstream 3′ss (indicated in B) are shown. (D) Scatterplot of upstream 3′ss scores (x-axis) and downstream 3′ss scores (y-axis). Each dot represents a skipped terminal exon with an upstream 3′ss and a downstream 3′ss for the same 5′ss. Solid squares are for poly(A) sites in the conserved set 1; solid triangles, for poly(A) sites in the conserved set 2; and gray circles, for poly(A) sites in the nonconserved set. (E) Boxplots of intron size for four groups of introns. Both upstream introns and full introns are shown. For boxplots, median values and P-values from the Wilcoxon tests comparing each group with group 1 are shown.