Skip to main content
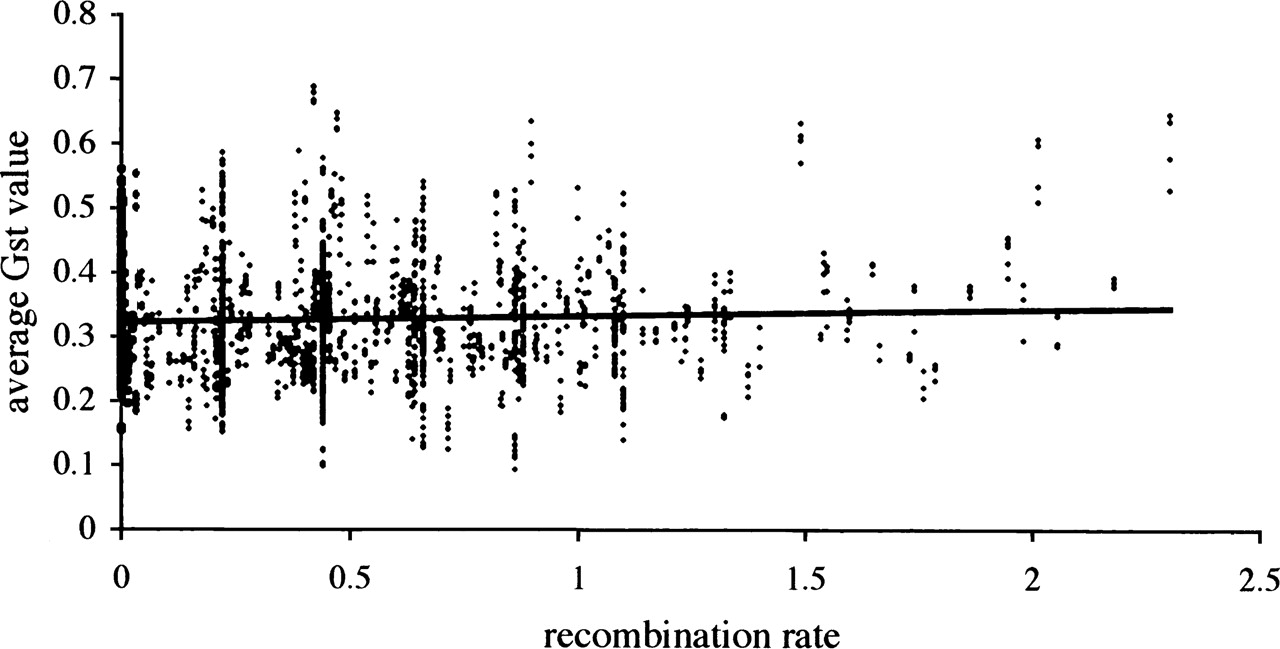
Figure 4.
Correlation between recombination rate and average G
st
in a sliding window size of 60 SNPs.